Modeling recent human evolution in mice by expression of a selected EDAR variant - PubMed (original) (raw)
. 2013 Feb 14;152(4):691-702.
doi: 10.1016/j.cell.2013.01.016.
Sijia Wang, Jingze Tan, Pascale Gerbault, Abigail Wark, Longzhi Tan, Yajun Yang, Shilin Li, Kun Tang, Hua Chen, Adam Powell, Yuval Itan, Dorian Fuller, Jason Lohmueller, Junhao Mao, Asa Schachar, Madeline Paymer, Elizabeth Hostetter, Elizabeth Byrne, Melissa Burnett, Andrew P McMahon, Mark G Thomas, Daniel E Lieberman, Li Jin, Clifford J Tabin, Bruce A Morgan, Pardis C Sabeti
Affiliations
- PMID: 23415220
- PMCID: PMC3575602
- DOI: 10.1016/j.cell.2013.01.016
Modeling recent human evolution in mice by expression of a selected EDAR variant
Yana G Kamberov et al. Cell. 2013.
Abstract
An adaptive variant of the human Ectodysplasin receptor, EDARV370A, is one of the strongest candidates of recent positive selection from genome-wide scans. We have modeled EDAR370A in mice and characterized its phenotype and evolutionary origins in humans. Our computational analysis suggests the allele arose in central China approximately 30,000 years ago. Although EDAR370A has been associated with increased scalp hair thickness and changed tooth morphology in humans, its direct biological significance and potential adaptive role remain unclear. We generated a knockin mouse model and find that, as in humans, hair thickness is increased in EDAR370A mice. We identify new biological targets affected by the mutation, including mammary and eccrine glands. Building on these results, we find that EDAR370A is associated with an increased number of active eccrine glands in the Han Chinese. This interdisciplinary approach yields unique insight into the generation of adaptive variation among modern humans.
Copyright © 2013 Elsevier Inc. All rights reserved.
Conflict of interest statement
The authors declare no conflict of interest.
Figures
Figure 1. Origins of 370A
(A) Haplotype distribution of the genomic region surrounding V370A, based on 24 SNPs covering ~139 kb. The six most common haplotypes are shown, and the remaining low frequency haplotypes grouped as “Others”. The chimpanzee allele was assumed to be ancestral. Derived alleles are in black, except for the 370A variant which is red. (B) The approximate posterior probability density for the geographic origin of 370A obtained by ABC simulation. The heat map was generated using 2D kernel density estimation of the latitude and longitude coordinates from the top 5,000 (0.46%) of 1,083,966 simulations. Red color represents the highest probability, and blue the lowest. See also Figures S1–5, S7 and Tables S1–S4.
Figure 2. Generation of the 370A mouse
(A) Conservation of human and mouse EDAR DD. 370V is in bold with superscript asterisk. (B) Targeting strategy for the introduction of the 370A mutation into the mouse Edar locus. The construct spans part of the Edar genomic sequence including exons 11 and 12 and contains the T1326C mutation (red line). The targeting vector also contained a neomycin (Neo) resistance cassette flanked by LoxP sites (purple arrows) inserted into the EDAR 3′ untranslated region (UTR). Neo was excised by breeding to a ubiquitously expressing β-Actin Cre line. The final genomic structure of the Edar knock-in locus is shown with exons as boxes, coding sequence in dark grey, UTR in black and all other genomic sequence as a black line. Diphtheria toxin A selection cassette (DTA) is shown in blue and vector sequence in light grey. (C) Appearance of 370V, 370V/370A and 370A animals and confirmation of the T1326C (underlined) substitution. See also Figure S6.
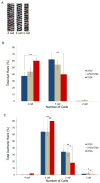
Figure 3. 370A allele increases hair size in the mouse coat
(A) Representative images of mouse hairs show medulla cell number serves as a proxy for hair shaft thickness. (B,C) 370A mice have a larger proportion of thicker hairs than mice expressing the ancestral allele. The average frequency (± SEM) of awl (B) and auchene (C) hairs of each size is shown. Significance levels of differences between 370V and 370A animals by ANOVA posthoc tests: [P < 0.05(*), P < 0.01(**)]. See also Table S5.
Figure 4. 370A does not increase Meibomian gland size
Representative images from 370V (A), 370V/370A (B) and 370A (C) mouse eyelids. Superorbital (white arrow) and suborbital (red arrow) Meibomian glands are visible through the connective tissue. (D) Average glandular area is shown (±SEM). Differences between genotypes did not reach statistical significance. See also Table S5.
Figure 5. 370A reduces the size of the mammary fat pad and increases mammary gland branch density
(A–D) Whole mount preparations of stained mammary glands. (A) Gland area (dotted line) and fat pad area (dashed line) are quantified from the main lactiferous duct (arrow head). Representative images are shown of 370V (B), 370V/370A (C) and 370A (D). Average branch density (± SEM) (E) and mean fat pad area (±SEM) (F) are shown. Significance levels by ANOVA posthoc tests: [P < 0.05(*), P < 0.01(**), P < 0.001(***)]. See also Table S5.
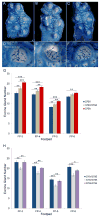
Figure 6. 370A increases the number of eccrine sweat glands in mice
Representative whole-mount preparations of the volar hindfoot skin of 370V (A), 370V/370A (B) and 370A (C) mice. Gland ducts appear as thin blue tubes emerging from inside the footpads (FP). Detail view of FP-3 from 370V (D), 370V/370A (E) and 370A (F) mice. (G) Quantification of average gland number per FP (±SEM) across the three genotypes. (H) 370A rescues the decrease in eccrine gland number in 379K heterozygous mutant mice. Average gland number per FP is shown (±SEM). Significance of differences by ANOVA posthoc tests: [P < 0.05(*), P < 0.01(**), P < 0.001(***)]. All experiments were carried out on fifth generation FVB backcross animals, but those shown in Figure 6H were a FVB by C3HeB/FeJ outcross. The difference in genetic background accounts for the difference in eccrine gland number between wildtype animals in 6G and 6H. See also Table S5.
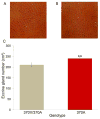
Figure 7. 370A is associated with increased eccrine sweat gland density in humans
(A, B) Representative cropped active sweat gland images of the digit tips of a 370V/370A heterozygous (A) and a 370A homozygous (B) individual. Cropped size is ~1.30 cm2. (C) Active sweat gland density is significantly increased in 370A individuals. See also Table S6.
Comment in
- A mouse following in the footsteps of human prehistory.
Vohr SH, Green RE. Vohr SH, et al. Cell. 2013 Feb 14;152(4):667-8. doi: 10.1016/j.cell.2013.01.039. Cell. 2013. PMID: 23415216
Similar articles
- Enhanced ectodysplasin-A receptor (EDAR) signaling alters multiple fiber characteristics to produce the East Asian hair form.
Mou C, Thomason HA, Willan PM, Clowes C, Harris WE, Drew CF, Dixon J, Dixon MJ, Headon DJ. Mou C, et al. Hum Mutat. 2008 Dec;29(12):1405-11. doi: 10.1002/humu.20795. Hum Mutat. 2008. PMID: 18561327 - The adaptive variant EDARV370A is associated with straight hair in East Asians.
Tan J, Yang Y, Tang K, Sabeti PC, Jin L, Wang S. Tan J, et al. Hum Genet. 2013 Oct;132(10):1187-91. doi: 10.1007/s00439-013-1324-1. Epub 2013 Jun 23. Hum Genet. 2013. PMID: 23793515 - Characterisation of a second gain of function EDAR variant, encoding EDAR380R, in East Asia.
Riddell J, Basu Mallick C, Jacobs GS, Schoenebeck JJ, Headon DJ. Riddell J, et al. Eur J Hum Genet. 2020 Dec;28(12):1694-1702. doi: 10.1038/s41431-020-0660-6. Epub 2020 Jun 4. Eur J Hum Genet. 2020. PMID: 32499598 Free PMC article. - The Edar subfamily in hair and exocrine gland development.
Mikkola ML. Mikkola ML. Adv Exp Med Biol. 2011;691:23-33. doi: 10.1007/978-1-4419-6612-4_3. Adv Exp Med Biol. 2011. PMID: 21153306 Review. No abstract available. - Edar signaling in the control of hair follicle development.
Botchkarev VA, Fessing MY. Botchkarev VA, et al. J Investig Dermatol Symp Proc. 2005 Dec;10(3):247-51. doi: 10.1111/j.1087-0024.2005.10129.x. J Investig Dermatol Symp Proc. 2005. PMID: 16382675 Review.
Cited by
- Thermal Adaptations in Animals: Genes, Development, and Evolution.
Agata A, Nomura T. Agata A, et al. Adv Exp Med Biol. 2024;1461:253-265. doi: 10.1007/978-981-97-4584-5_18. Adv Exp Med Biol. 2024. PMID: 39289287 Review. - SVhawkeye: an ultra-fast software for user-friendly visualization of targeted structural fragments from BAM files.
Xiao Y, Yu T, Liang F, Hou T. Xiao Y, et al. Front Genet. 2024 Apr 24;15:1352443. doi: 10.3389/fgene.2024.1352443. eCollection 2024. Front Genet. 2024. PMID: 38721473 Free PMC article. - Malaria resistance-related biological adaptation and complex evolutionary footprints inferred from one integrative Tai-Kadai-related genomic resource.
Duan S, Wang M, Wang Z, Liu Y, Jiang X, Su H, Cai Y, Sun Q, Sun Y, Li X, Chen J, Zhang Y, Yan J, Nie S, Hu L, Tang R, Yun L, Wang CC, Liu C, Yang J, He G. Duan S, et al. Heliyon. 2024 Apr 9;10(8):e29235. doi: 10.1016/j.heliyon.2024.e29235. eCollection 2024 Apr 30. Heliyon. 2024. PMID: 38665582 Free PMC article. - Differentiated adaptative genetic architecture and language-related demographical history in South China inferred from 619 genomes from 56 populations.
Sun Q, Wang M, Lu T, Duan S, Liu Y, Chen J, Wang Z, Sun Y, Li X, Wang S, Lu L, Hu L, Yun L, Yang J, Yan J, Nie S, Zhu Y, Chen G, Wang CC, Liu C, He G, Tang R. Sun Q, et al. BMC Biol. 2024 Mar 6;22(1):55. doi: 10.1186/s12915-024-01854-9. BMC Biol. 2024. PMID: 38448908 Free PMC article. - Uncovering the genetic architecture and evolutionary roots of androgenetic alopecia in African men.
Janivara R, Hazra U, Pfennig A, Harlemon M, Kim MS, Eaaswarkhanth M, Chen WC, Ogunbiyi A, Kachambwa P, Petersen LN, Jalloh M, Mensah JE, Adjei AA, Adusei B, Joffe M, Gueye SM, Aisuodionoe-Shadrach OI, Fernandez PW, Rohan TE, Andrews C, Rebbeck TR, Adebiyi AO, Agalliu I, Lachance J. Janivara R, et al. bioRxiv [Preprint]. 2024 Jan 15:2024.01.12.575396. doi: 10.1101/2024.01.12.575396. bioRxiv. 2024. PMID: 38293167 Free PMC article. Preprint.
References
- Anderson P, Frisch RE, Graham CE, Manderson L, Orubuloye IO, Philippe P, Raphael D, Stini WA, Esterik PV. The Reproductive Role of the Human Breast [and Comments and Reply] Current Anthropology. 1983;24:25–45.
- Bertorelle G, Benazzo A, Mona S. ABC as a flexible framework to estimate demography over space and time: some cons, many pros. Mol Ecol. 2010;19:2609–2625. - PubMed
- Bramble DM, Lieberman DE. Endurance running and the evolution of Homo. Nature. 2004;432:345–352. - PubMed
Publication types
MeSH terms
Substances
Grants and funding
- R01 AI114855/AI/NIAID NIH HHS/United States
- 1DP2OD006514-01/OD/NIH HHS/United States
- R01 AR055256/AR/NIAMS NIH HHS/United States
- R37 HD032443/HD/NICHD NIH HHS/United States
- DP2 OD006514/OD/NIH HHS/United States
- R37 054364/PHS HHS/United States
LinkOut - more resources
Full Text Sources
Other Literature Sources
Molecular Biology Databases


