Depletion of FOXP3+ regulatory T cells promotes hypercholesterolemia and atherosclerosis - PubMed (original) (raw)
. 2013 Mar;123(3):1323-34.
doi: 10.1172/JCI63891. Epub 2013 Feb 15.
Norbert Gerdes, Robert M Badeau, Anton Gisterå, Daniela Strodthoff, Daniel F J Ketelhuth, Anna M Lundberg, Mats Rudling, Stefan K Nilsson, Gunilla Olivecrona, Stefan Zoller, Christine Lohmann, Thomas F Lüscher, Matti Jauhiainen, Tim Sparwasser, Göran K Hansson
Affiliations
- PMID: 23426179
- PMCID: PMC3582120
- DOI: 10.1172/JCI63891
Depletion of FOXP3+ regulatory T cells promotes hypercholesterolemia and atherosclerosis
Roland Klingenberg et al. J Clin Invest. 2013 Mar.
Abstract
Atherosclerosis is a chronic inflammatory disease promoted by hyperlipidemia. Several studies support FOXP3-positive regulatory T cells (Tregs) as inhibitors of atherosclerosis; however, the mechanism underlying this protection remains elusive. To define the role of FOXP3-expressing Tregs in atherosclerosis, we used the DEREG mouse, which expresses the diphtheria toxin (DT) receptor under control of the Treg-specific Foxp3 promoter, allowing for specific ablation of FOXP3+ Tregs. Lethally irradiated, atherosclerosis-prone, low-density lipoprotein receptor-deficient (Ldlr(-/-)) mice received DEREG bone marrow and were injected with DT to eliminate FOXP3(+) Tregs. Depletion of Tregs caused a 2.1-fold increase in atherosclerosis without a concomitant increase in vascular inflammation. These mice also exhibited a 1.7-fold increase in plasma cholesterol and an atherogenic lipoprotein profile with increased levels of VLDL. Clearance of VLDL and chylomicron remnants was hampered, leading to accumulation of cholesterol-rich particles in the circulation. Functional and protein analyses complemented by gene expression array identified reduced protein expression of sortilin-1 in liver and increased plasma enzyme activity of lipoprotein lipase, hepatic lipase, and phospholipid transfer protein as mediators of the altered lipid phenotype. These results demonstrate that FOXP3(+) Tregs inhibit atherosclerosis by modulating lipoprotein metabolism.
Figures
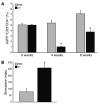
Figure 1. Effective depletion of transgenic Treg cells is achieved in chimeric DEREG_/Ldlr_–/– mice.
(A) Proportions of cells expressing eGFP within the CD3+CD4+ population in inguinal lymph nodes from chimeric DEREG_/Ldlr_–/– mice treated with DT or PBS harvested at 4 and 8 weeks, respectively (n = 6–7 mice per group). (B) Proliferation of lymph node cells from chimeric DEREG_/Ldlr_–/– mice treated for 8 weeks with DT or PBS and stimulated in vitro with anti-CD3. Data show stimulation index based on 3H-thymidine uptake (n = 4 mice per group). *P < 0.05.
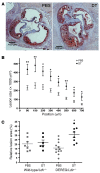
Figure 2. Depletion of transgenic Tregs aggravates atherosclerosis.
(A) Representative photomicrographs showing Oil Red O- and H&E-stained sections from the proximal aorta of chimeric DEREG/_Ldlr_–/– mice treated for 8 weeks with PBS or DT. (B) Quantification of lesion size in cross-sections of the proximal aorta at different levels from the valves; n = 11–12 (PBS) mice and n = 5–8 (DT) mice, respectively. (C) Relative lesion area (lesion area/area inside external elastic lamina × 100) calculated from 4 sections per mouse (300–600 μm) for wild-type/_Ldlr_–/– and DEREG/_Ldlr_–/– mice treated for 8 weeks with PBS or DT, respectively. *P < 0.05; **P < 0.01. Scale bars: 100 μm.
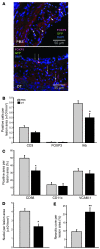
Figure 3. Depletion of Tregs affects cellular composition of atheroma.
(A) Representative fluorescence micrographs depicting eGFP+FOXP3+ cells (arrowheads) and eGFP–FOXP3+ (arrows) cells in aortic lesions of DEREG/_Ldlr_–/– mice treated for 8 weeks with PBS or DT. Anti-GFP was labeled with AlexaFluor 488 (green), anti-FOXP3 with AlexaFluor 555 (red), and nuclei with DAPI (blue). (B) Quantitation of immunohistochemical staining for T cells (CD3+), Tregs (FOXP3+), and I-Ab–expressing (MHCII-expressing) cells (all expressed as stained cells per lesion area) in the proximal aorta of chimeric DEREG/_Ldlr_–/– mice treated for 8 weeks with DT or PBS; n = 7–8 mice per group. (C) Quantitation of immunohistochemical staining for macrophages (CD68+), dendritic cells (CD11c+), and expression of the adhesion molecule VCAM-1 (all expressed as stained area per lesion area) in the aortic sinus of chimeric DEREG/_Ldlr_–/– mice treated for 8 weeks with DT or PBS; n = 7–8 mice per group. (D) Cellularity of atherosclerotic lesions (DAPI+ nuclei per lesion area) in the proximal aorta of chimeric DEREG/_Ldlr_–/– mice treated for 8 weeks with PBS or DT; n = 7–8 mice per group. (E) Necrotic core area relative to total atherosclerotic lesion area in the proximal aorta of chimeric DEREG/_Ldlr_–/– mice treated for 8 weeks with PBS or DT; n = 7–8 mice per group. *P < 0.05; **P < 0.01. Scale bars: 50 μm.
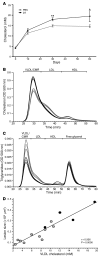
Figure 4. DT-induced depletion of transgenic Tregs promotes hypercholesterolemia.
(A) Changes in plasma cholesterol levels during treatment of DEREG/_Ldlr_–/– bone marrow chimeras with DT or PBS; n = 5 per group. *P < 0.05; **P < 0.01. (B) Fast protein liquid chromatographic (FPLC) analysis of plasma lipoprotein profiles from DEREG/_Ldlr_–/– bone marrow chimeras treated for 8 weeks with PBS (gray line) or DT (black line). The cholesterol concentration in each fraction (y axis) is plotted against retention time (x axis), with the corresponding lipoprotein fractions (identified by human plasma standards) indicated at the top. Mean (thick line) and SEM (fine lines) are shown; n = 5 per group. (C) FPLC analysis of plasma lipoprotein profiles from DEREG/_Ldlr_–/– bone marrow chimeras treated for 8 weeks with PBS (gray line) or DT (black line). The triglyceride concentration in each fraction (y axis) is plotted against retention time (x axis), with the corresponding lipoprotein fractions (identified by human plasma standards) indicated at the top. Mean (thick line) and SEM (fine lines) are shown; n = 5 per group. (D) Spearman’s rank correlation analysis for VLDLs and atherosclerotic lesion size in the proximal aorta. Each dot represents an individual mouse and the curve is plotted with the corresponding correlation coefficient (r value) displayed. DT is represented by black circles; PBS is represented by gray circles.
Figure 5. VLDL/CMR lipoprotein catabolism is impaired in Treg-depleted mice.
(A) Biosynthesis of apoB-containing plasma lipoproteins. Data show plasma cholesterol levels in chimeric DEREG/_Ldlr_–/– mice treated for 8 weeks with DT or PBS followed by i.v. administration of Triton WR-1339 to inhibit lipoprotein lipase–dependent VLDL catabolism; n = 9 (PBS) and n = 7 (DT), respectively. (B) Clearance of injected FITC-VLDL in chimeric DEREG/_Ldlr_–/– mice treated for 8 weeks with DT or PBS. FITC-derived fluorescence was analyzed in plasma samples at the indicated time points. Data for each individual were normalized to the fluorescence of plasma taken 1 minute after injection; n = 4 per group. (C) In vivo turnover of CM particles injected into chimeric DEREG/_Ldlr_–/– mice treated for 8 weeks with DT or PBS. Data show kinetics of the CM [14C] retinol core particle clearance from blood and are expressed as radiolabeled moieties corrected for weight; n = 5 (PBS); n = 7 (DT). (D) CM [14C] retinol uptake in the liver. Data expressed as radiolabeled moieties corrected for weight; n = 5 (PBS); n = 7 (DT). *P < 0.05.
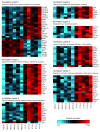
Figure 6. Gene expression array analysis shows changes in liver transcriptomes upon Treg depletion.
Shown here are gene expression heat maps of global Affymetrix gene expression array analysis of liver RNA from DEREG/_Ldlr_–/– mice. The rows correspond to genes and the columns to individual mice treated with DT or PBS, respectively. Relative gene expression is shown based on normalization for each gene in the DT- and PBS-treated groups. Color coding indicates increased gene expression in red, and decreased expression in blue compared with the other group, respectively. Sets of genes involved in functional annotation clusters as defined by the DAVID annotation analysis are grouped accordingly. Arbitrary titles that summarize the functional role of displayed genes in a cluster are shown in parentheses. Clusters show differentially expressed transcripts based on an FDR less than 0.1 and an absolute linear fold change greater than 1.5.
Figure 7. Treg depletion modulates expression of genes controlling inflammation and lipid metabolism in the liver.
Quantitative real-time RT-PCR analysis of liver mRNA from DEREG/_Ldlr_–/– mice treated for 8 weeks with DT or PBS. Signals were normalized to Hprt. *P < 0.05; n = 6 per group. (A) Ifng, (B) Tnfa, (C) Cd3, (D) Apoc3, (E) Apob, (F) Dgat, (G) Lpl, (H) Lipc, (I) Vldlr, (J) Pltp, (K) Sort1, and (L) Atf3.
Figure 8. Effects of Treg depletion on sortilin-1, LPL, HL, and PLTP.
(A) Immunoblot of liver tissue showing sortilin-1 protein in DT- or PBS-treated DEREG/_Ldlr_–/– mice. Full uncut images of sortilin-1 and tubulin immunoblots are shown in Supplemental Figure 7. (B) Scattergram shows individual values expressed as a ratio of sortilin-1 protein expression to α–tubulin protein expression. (C) LPL activity in postheparin plasma was measured using [3H]-labeled triolein in an emulsion with Intralipid 10% composition as the enzyme substrate; n = 10 (PBS); n = 9 (DT). (D) HL activity in postheparin plasma was measured using a gum arabic–stabilized emulsion; n = 10 (PBS); n = 9 (DT). (E) PLTP activity was measured using an exogenous lipoprotein-independent phospholipid transfer assay; n = 10 (PBS); n = 10 (DT). All data are from DEREG/_Ldlr_–/– mice treated for 8 weeks with DT or PBS. Mean ± SEM is shown. *P < 0.05; **P < 0.01.
Similar articles
- Depletion of Foxp3+ regulatory T cells augments CD4+ T cell immune responses in atherosclerosis-prone hypercholesterolemic mice.
Kasahara K, Sasaki N, Amin HZ, Tanaka T, Horibe S, Yamashita T, Hirata KI, Rikitake Y. Kasahara K, et al. Heliyon. 2022 Jul 19;8(7):e09981. doi: 10.1016/j.heliyon.2022.e09981. eCollection 2022 Jul. Heliyon. 2022. PMID: 35898604 Free PMC article. - Limitations of Foxp3(+) Treg depletion following viral infection in DEREG mice.
Christiaansen AF, Boggiatto PM, Varga SM. Christiaansen AF, et al. J Immunol Methods. 2014 Apr;406:58-65. doi: 10.1016/j.jim.2014.03.005. Epub 2014 Mar 15. J Immunol Methods. 2014. PMID: 24642426 Free PMC article. - Regulatory T Cell Stability and Plasticity in Atherosclerosis.
Ali AJ, Makings J, Ley K. Ali AJ, et al. Cells. 2020 Dec 11;9(12):2665. doi: 10.3390/cells9122665. Cells. 2020. PMID: 33322482 Free PMC article. Review. - The role of lipid metabolism in shaping the expansion and the function of regulatory T cells.
Pinzon Grimaldos A, Bini S, Pacella I, Rossi A, Di Costanzo A, Minicocci I, D'Erasmo L, Arca M, Piconese S. Pinzon Grimaldos A, et al. Clin Exp Immunol. 2022 Jun 11;208(2):181-192. doi: 10.1093/cei/uxab033. Clin Exp Immunol. 2022. PMID: 35020862 Free PMC article. Review.
Cited by
- Novel insights of disulfidptosis-mediated immune microenvironment regulation in atherosclerosis based on bioinformatics analyses.
Zhao H, Jin Z, Li J, Fang J, Wu W, Fang JF. Zhao H, et al. Sci Rep. 2024 Nov 9;14(1):27336. doi: 10.1038/s41598-024-78392-5. Sci Rep. 2024. PMID: 39521794 Free PMC article. - Causal relationship between immune cells and risk of myocardial infarction: evidence from a Mendelian randomization study.
Cao W, Wang K, Wang J, Chen Y, Gong H, Xiao L, Pan W. Cao W, et al. Front Cardiovasc Med. 2024 Aug 27;11:1416112. doi: 10.3389/fcvm.2024.1416112. eCollection 2024. Front Cardiovasc Med. 2024. PMID: 39257847 Free PMC article. - Mini-Review: Immunogenic epitopes in apolipoprotein B-100 for atheroprotective immunization.
Gerdes N, Klingenberg R. Gerdes N, et al. Front Cardiovasc Med. 2024 Aug 15;11:1448664. doi: 10.3389/fcvm.2024.1448664. eCollection 2024. Front Cardiovasc Med. 2024. PMID: 39211769 Free PMC article. Review. - Developmental endothelial locus 1: the present and future of an endogenous factor in vessels.
Jiang D, Yue H, Liang WT, Wu Z. Jiang D, et al. Front Physiol. 2024 Aug 9;15:1347888. doi: 10.3389/fphys.2024.1347888. eCollection 2024. Front Physiol. 2024. PMID: 39206385 Free PMC article. Review. - Atherosclerosis antigens as targets for immunotherapy.
Raposo-Gutiérrez I, Rodríguez-Ronchel A, Ramiro AR. Raposo-Gutiérrez I, et al. Nat Cardiovasc Res. 2023 Dec;2(12):1129-1147. doi: 10.1038/s44161-023-00376-x. Epub 2023 Dec 11. Nat Cardiovasc Res. 2023. PMID: 39196152 Review.
References
Publication types
MeSH terms
Substances
LinkOut - more resources
Full Text Sources
Other Literature Sources
Medical
Molecular Biology Databases
