Ribosome structures to near-atomic resolution from thirty thousand cryo-EM particles - PubMed (original) (raw)
Ribosome structures to near-atomic resolution from thirty thousand cryo-EM particles
Xiao-Chen Bai et al. Elife. 2013.
Abstract
Although electron cryo-microscopy (cryo-EM) single-particle analysis has become an important tool for structural biology of large and flexible macro-molecular assemblies, the technique has not yet reached its full potential. Besides fundamental limits imposed by radiation damage, poor detectors and beam-induced sample movement have been shown to degrade attainable resolutions. A new generation of direct electron detectors may ameliorate both effects. Apart from exhibiting improved signal-to-noise performance, these cameras are also fast enough to follow particle movements during electron irradiation. Here, we assess the potentials of this technology for cryo-EM structure determination. Using a newly developed statistical movie processing approach to compensate for beam-induced movement, we show that ribosome reconstructions with unprecedented resolutions may be calculated from almost two orders of magnitude fewer particles than used previously. Therefore, this methodology may expand the scope of high-resolution cryo-EM to a broad range of biological specimens.DOI:http://dx.doi.org/10.7554/eLife.00461.001.
Keywords: Bayesian; Direct electron detectors; Electron Microscopy; Image processing; S. cerevisiae; T. thermophilus; ribosome.
Conflict of interest statement
The authors declare that no competing interest exist.
Figures
Figure 1.. 70S data collected on a back-thinned FEI Falcon detector.
(A) The 16-frame (1-s) average of two untilted videos. The scale bar indicates 50 nm. Relative positions for independently aligned four-frame averaged particles are shown with circles connected by white lines. The relative position of the average from the first four frames is shown in green, the relative position of the last four frames in red. The differences between these relative positions are exaggerated 25 times for improved clarity, and only those four-frame averages for which correct alignment was confirmed by tilt-pair analysis are included. Movements in the area on the left are smaller (up to 1.5 Å) then in the area on the right (up to 10 Å). (B) Examples of two individual ribosome particles as averages over a decreasing number of video frames. The scale bar indicates 20 nm. Zoomed-in areas of micrographs, additional individual particles and reference-free 2D class averages for both the 70S and 80S data are shown in Figure 1—figure supplement 1. DOI:
http://dx.doi.org/10.7554/eLife.00461.003
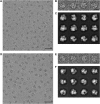
Figure 1—figure supplement 1.. Part of a recorded micrograph and reference-free class averages for the 70S and 80S data sets.
The scale bar indicates 50 nm. (B) Individual 70S particles. The scale bar indicates 20 nm. (C) Reference-free 2D class averages showing distinct views of the 70S ribosome. (D–F) As in (A–C), but for the 80S data. The scale bar indicates 50 nm. DOI:
http://dx.doi.org/10.7554/eLife.00461.004
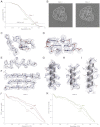
Figure 2.. Development of video processing procedures on the 70S data set.
(A) Histogram of tilt-pair alignment errors for particles that were calculated as 16-frame averages. The width of the first peak at half its height is 2°. This value is plotted as the tilt-pair alignment precision in (B). (B) Tilt-pair alignment precision (top) and the number of incorrectly aligned particle pairs (bottom) for independent refinements of 16-frame, 8-frame, 6-frame, 4-frame and 2-frame averages (ranges in frame numbers are indicated on the x-axis); the total number of particle pairs was 15,202. Particle pairs with alignment errors larger than three times the reported precision were considered as aligned incorrectly. (C) Gold-standard FSC curves. The same blue colors are used as in (B); orange lines indicate the results of the statistical video-processing approach described in the main text. (D) FSC-curves between a rigid-body fitted atomic model and the cryo-EM maps (using the same color scheme as in [C]). (E–F) Illustrative density and atomic model for the reconstructions obtained from 16-frame averaged particles (light blue), independently refined four-frame averages (dark blue) and the statistical video processing procedure (orange). The density maps were sharpened with B-factors of −211, −185 and −178 Å2, respectively. Complete density maps for these three reconstructions are shown in Figure 2—figure supplement 1. DOI:
http://dx.doi.org/10.7554/eLife.00461.005
Figure 2—figure supplement 1.. Overall views of the 70S ribosome reconstructions obtained from 16-frame averaged particles (left), independently refined four-frame averages (middle) and the statistical video processing procedure (right).
The large subunit is shown in blue; the small subunit in yellow. DOI:
http://dx.doi.org/10.7554/eLife.00461.006
Figure 3.. Application of the statistical video processing procedure to an 80S ribosome data set.
(A) Gold-standard FSC curves for class 1 (red) and class 2 (green). (B) Slices through the reconstructions of class 1 (left) and class 2 (right). The fuzzy appearance for the density of the 40S subunits (green and red lines) is an indication of unresolved structural heterogeneity. (C–G) Densities for the 60S subunit of class 1 showing a protein loop interacting with a flipped-out RNA base (C), a short stretch of an RNA helix (D), a β-strand (E), a β-sheet (F), and an α-helix (G). (H–I) Density for the 40S subunit of class 1 showing a well-resolved α-helix (H) and a poorly-resolved one (I). The density map of class 1 was sharpened with a B-factor of −160 Å2. (J) FSC curves between the map of class 1 and the rigid-body fitted atomic models of the entire 80S particle, and for the 40S and 60S subunits separately. (K) As in J, but for class 2. DOI:
http://dx.doi.org/10.7554/eLife.00461.008
Comment in
- doi: 10.7554/eLife.00573
Similar articles
- Beam-induced motion correction for sub-megadalton cryo-EM particles.
Scheres SH. Scheres SH. Elife. 2014 Aug 13;3:e03665. doi: 10.7554/eLife.03665. Elife. 2014. PMID: 25122622 Free PMC article. - Cryo-EM structure of the hibernating Thermus thermophilus 100S ribosome reveals a protein-mediated dimerization mechanism.
Flygaard RK, Boegholm N, Yusupov M, Jenner LB. Flygaard RK, et al. Nat Commun. 2018 Oct 9;9(1):4179. doi: 10.1038/s41467-018-06724-x. Nat Commun. 2018. PMID: 30301898 Free PMC article. - The impact of recent improvements in cryo-electron microscopy technology on the understanding of bacterial ribosome assembly.
Razi A, Britton RA, Ortega J. Razi A, et al. Nucleic Acids Res. 2017 Feb 17;45(3):1027-1040. doi: 10.1093/nar/gkw1231. Nucleic Acids Res. 2017. PMID: 28180306 Free PMC article. Review. - Low cost, high performance processing of single particle cryo-electron microscopy data in the cloud.
Cianfrocco MA, Leschziner AE. Cianfrocco MA, et al. Elife. 2015 May 8;4:e06664. doi: 10.7554/eLife.06664. Elife. 2015. PMID: 25955969 Free PMC article. - Cryogenic electron microscopy and single-particle analysis.
Elmlund D, Elmlund H. Elmlund D, et al. Annu Rev Biochem. 2015;84:499-517. doi: 10.1146/annurev-biochem-060614-034226. Epub 2015 Feb 26. Annu Rev Biochem. 2015. PMID: 25747402 Review.
Cited by
- Direct detection pays off for electron cryo-microscopy.
Grigorieff N. Grigorieff N. Elife. 2013 Feb 19;2:e00573. doi: 10.7554/eLife.00573. Elife. 2013. PMID: 23426864 Free PMC article. - Cryo-EM structure of fatty acid synthase (FAS) from Rhodosporidium toruloides provides insights into the evolutionary development of fungal FAS.
Fischer M, Rhinow D, Zhu Z, Mills DJ, Zhao ZK, Vonck J, Grininger M. Fischer M, et al. Protein Sci. 2015 Jun;24(6):987-95. doi: 10.1002/pro.2678. Epub 2015 Apr 2. Protein Sci. 2015. PMID: 25761671 Free PMC article. - Likelihood-based classification of cryo-EM images using FREALIGN.
Lyumkis D, Brilot AF, Theobald DL, Grigorieff N. Lyumkis D, et al. J Struct Biol. 2013 Sep;183(3):377-388. doi: 10.1016/j.jsb.2013.07.005. Epub 2013 Jul 17. J Struct Biol. 2013. PMID: 23872434 Free PMC article. - Retroviral integration into nucleosomes through DNA looping and sliding along the histone octamer.
Wilson MD, Renault L, Maskell DP, Ghoneim M, Pye VE, Nans A, Rueda DS, Cherepanov P, Costa A. Wilson MD, et al. Nat Commun. 2019 Sep 13;10(1):4189. doi: 10.1038/s41467-019-12007-w. Nat Commun. 2019. PMID: 31519882 Free PMC article. - Cryo-electron Tomography Remote Data Collection and Subtomogram Averaging.
Sheng Y, Morris K, Radecke J, Zhang P. Sheng Y, et al. J Vis Exp. 2022 Jul 12;(185):10.3791/63923. doi: 10.3791/63923. J Vis Exp. 2022. PMID: 35913165 Free PMC article.
References
- Ben-Shem A, Garreau de Loubresse N, Melnikov S, Jenner L, Yusupova G, Yusupov M. 2011. The structure of the eukaryotic ribosome at 3.0 Å resolution. Science 334:1524–9 - PubMed
Publication types
MeSH terms
LinkOut - more resources
Full Text Sources
Other Literature Sources
Molecular Biology Databases


