Metabotropic NMDA receptor function is required for NMDA receptor-dependent long-term depression - PubMed (original) (raw)
Metabotropic NMDA receptor function is required for NMDA receptor-dependent long-term depression
Sadegh Nabavi et al. Proc Natl Acad Sci U S A. 2013.
Abstract
NMDA receptor (NMDAR) activation controls long-term potentiation (LTP) as well as long-term depression (LTD) of synaptic transmission, cellular models of learning and memory. A long-standing view proposes that a high level of Ca(2+) entry through NMDARs triggers LTP; lower Ca(2+) entry triggers LTD. Here we show that ligand binding to NMDARs is sufficient to induce LTD; neither ion flow through NMDARs nor Ca(2+) rise is required. However, basal levels of Ca(2+) are permissively required. Lowering, but not maintaining, basal Ca(2+) levels with Ca(2+) chelators blocks LTD and drives strong synaptic potentiation, indicating that basal Ca(2+) levels control NMDAR-dependent LTD and basal synaptic transmission. Our findings indicate that metabotropic actions of NMDARs can weaken active synapses without raising postsynaptic calcium, thereby revising and expanding the mechanisms controlling synaptic plasticity.
Conflict of interest statement
The authors declare no conflict of interest.
Figures
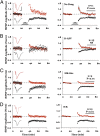
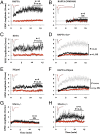
Fig. 1.
NMDAR-dependent LTD requires ligand binding but not ion-channel flux through NMDAR. (A) Field potential recordings from two independent pathways; one pathway (black symbols) received a 1-Hz, 15-min stimulus where indicated. The control pathway (red symbols) received no stimulus. (Left) Individual experiment; (Right), collated average. (Inset) Average field responses obtained before and after LFS delivery. (B) LFS-induced depression is blocked by inclusion of 100 μM
D
-APV in the bath. (C) LFS-induced depression is not blocked by 100 μM MK-801. Slices were incubated for 3–4 h in 100 μM MK-801 before transfer to the recording chamber, which also included 100 μM MK-801. (D) LFS-induced depression is not blocked by inclusion of 100 μM 7CK in the bath. In approximately half of the experiments shown in A, B, C, and D 4 μM MTEP was included in the bath to rule out the possible involvement of mGluR5; there was no difference in results with and without MTEP (
Fig. S5
). Error bars throughout represent SEM. Statistics throughout: paired t test when comparing cell pairs; unpaired t test when comparing across different slices. (Scale bars, 0.3 mV, 5 ms.)
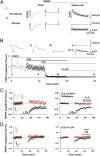
Fig. 2.
MK-801 and 7CK fully block NMDAR-mediated responses even during LTD induction. (A, Left) Average of five AMPAR-mediated field responses in the absence of MK-801; 10 μM NBQX was added (A, Center), and whole-cell responses were obtained at holding potential of +40 mV displaying (A, Right) the first five evoked NMDAR-mediated responses (gray lines) along with an average (black line). (Scale bars, Left, 0.3 mV, 5 ms; Right, 100 pA, 100 ms.) The integrated NMDA current relative to the integrated (AMPAR-mediated) field potential was 6.5 × 10³ pA/mV. (A, ii) Same as A, i but slices were incubated in 100 μM MK-801 for 2 h before and during recordings, producing an integrated NMDA current to integrated AMPAR-mediated field potential of 16.5 pA/mV. (B) Plot of NMDAR-mediated whole-cell response vs. time. (Inset) Average of 10 responses obtained where indicated. Note little difference between B, iii and B, iv, indicating that 7CK completely blocks NMDAR-mediated response, even during LFS. For A and B similar results were obtained in two independent experiments. (C and D) Field potential recordings with one pathway (black symbols) receiving a 1-Hz, 15-min stimulus where indicated, and the other control pathway (red symbols) receiving no stimulus. (Left) Individual experiment; (Right) collated average. (Inset) Average field responses obtained before and after LFS delivery. (Scale bars, 0.3 mV, 5 ms.) (C) LFS-induced depression is not blocked by inclusion of 7CK (100 μM) + MTEP (4 μM) + nifedipine (100 μM). (D) LFS-induced depression is blocked by inclusion of 7CK (100 μM) +
D
-APV (100 μM).
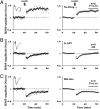
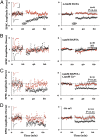
Fig. 3.
Blockade of ion flux through NMDAR reverses the direction of synaptic plasticity induced by 100 Hz stimulation. (A) In the absence of NMDAR antagonist, 100 Hz tetani (arrows) induced LTP of the field potential, which is fully blocked by 100 μm
D
-APV (B). Inclusion of 100 μM MK-801, however, causes a long lasting depression (C). (Left) Individual experiment; (Right) Collated average. (Inset) Average field responses obtained before and after tetani delivery. (Scale bars, 0.3 mV, 5 ms.)
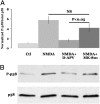
Fig. 4.
NMDAR-dependent phosphorylation of p38 requires ligand binding but not ion-channel flux through NMDAR. (A) NMDA (40 μM) increase p38 phosphorylation (NMDA), which is largely blocked by 100 μM
D
-APV (NMDA+
D
-APV) but not by 100 μM MK-801 (NMDA+MK-801). Magnitude of p38 phosphorylation is normalized to the no-treatment (Ctl). (B) Individual experiment (n = 12).
Fig. 5.
Lowering cytoplasmic Ca2+ level with high chelator concentration selectively enhances AMPAR-mediated synaptic transmission. (A) Amplitude plot of AMPAR-mediated transmission from two nearby CA1 hippocampal pyramidal neurons obtained by simultaneous whole-cell recordings (holding potential at −60 mV) with internal solution containing 0.6 mM EGTA (red symbols) or 15 mM BAPTA (black symbols). (Inset) Average responses simultaneously recorded from the two cells. (B) Same as A for NMDAR-mediated transmission (holding potential at +40 mV). Note the large discrepancy in AMPAR-mediated responses with similar NMDAR-mediated responses from the two neurons. (C) Same as A but cells contain 0.6 mM EGTA (red) and 15 mM EGTA (black). (D) Same as A but cells contain 0.6 mM EGTA (red) and 15 mM BAPTA + 1.3 mM Ca2+ (black); light gray symbols show synaptic responses to 15 mM BAPTA (from A) for comparison. (Scale bars, 200 pA, 20 ms.) (E) Same as A but one cell (black) contained 100 μM FK-506 in the internal solution (0.6 mM EGTA in both cells). (F) Same as A but slices were incubated prior (1–2 h) and during whole-cell recordings with 100 μM FK-506 in the bath. Light gray symbols indicate responses (from A) in the absence of FK-506 for comparison. (G) BAPTA failed to induce synaptic potentiation (black) in mice lacking GluA1 (GluA1−/−); however, it was effective in the wild-type littermates (GluA1+/+).
Fig. 6.
Clamping intracellular Ca2+ to basal levels does not block LTD. (A_–_D) Plot of whole-cell synaptic responses with internal solution containing 0.6 mM EGTA; LFS delivered to one path (black symbols) where indicated; control path not stimulated (red symbols). (Left) Individual experiment; (Right) collated averages; error bars SEM. (A) LFS induces stable LTD. (B) LTD is blocked with internal solution containing 15 mM BAPTA. (C) LTD is not blocked with internal solution containing 15 mM BAPTA + 1.3 mM Ca2+. (D) Hyperpolarization to −80 mV during LFS does not inhibit LTD.
Similar articles
- Mechanisms of group I mGluR-dependent long-term depression of NMDA receptor-mediated transmission at Schaffer collateral-CA1 synapses.
Ireland DR, Abraham WC. Ireland DR, et al. J Neurophysiol. 2009 Mar;101(3):1375-85. doi: 10.1152/jn.90643.2008. Epub 2008 Dec 24. J Neurophysiol. 2009. PMID: 19109458 - Hippocampal long-term synaptic plasticity and signal amplification of NMDA receptors.
MacDonald JF, Jackson MF, Beazely MA. MacDonald JF, et al. Crit Rev Neurobiol. 2006;18(1-2):71-84. doi: 10.1615/critrevneurobiol.v18.i1-2.80. Crit Rev Neurobiol. 2006. PMID: 17725510 Review. - Essential roles of mGluR1 and inhibitory synaptic transmission in NMDA-independent long-term potentiation in the spinal trigeminal interpolaris.
Kim SY, Weon H, Youn DH. Kim SY, et al. Life Sci. 2016 Jan 1;144:54-60. doi: 10.1016/j.lfs.2015.11.024. Epub 2015 Nov 24. Life Sci. 2016. PMID: 26620765 - Long-term potentiation and the role of N-methyl-D-aspartate receptors.
Volianskis A, France G, Jensen MS, Bortolotto ZA, Jane DE, Collingridge GL. Volianskis A, et al. Brain Res. 2015 Sep 24;1621:5-16. doi: 10.1016/j.brainres.2015.01.016. Epub 2015 Jan 22. Brain Res. 2015. PMID: 25619552 Free PMC article. Review.
Cited by
- Modulation of NMDA Receptors by G-protein-coupled receptors: Role in Synaptic Transmission, Plasticity and Beyond.
Lutzu S, Castillo PE. Lutzu S, et al. Neuroscience. 2021 Feb 21;456:27-42. doi: 10.1016/j.neuroscience.2020.02.019. Epub 2020 Feb 24. Neuroscience. 2021. PMID: 32105741 Free PMC article. Review. - Nociceptor activity induces nonionotropic NMDA receptor signaling to enable spinal reconsolidation and reverse pathological pain.
Zhang H, Rodriguez-Hernandez LD, D'Souza AJ, He D, Zain M, Fung SW, Bennett LA, Bonin RP. Zhang H, et al. Sci Adv. 2023 May 19;9(20):eadg2819. doi: 10.1126/sciadv.adg2819. Epub 2023 May 19. Sci Adv. 2023. PMID: 37205760 Free PMC article. - A novel missense variant in ACAA1 contributes to early-onset Alzheimer's disease, impairs lysosomal function, and facilitates amyloid-β pathology and cognitive decline.
Luo R, Fan Y, Yang J, Ye M, Zhang DF, Guo K, Li X, Bi R, Xu M, Yang LX, Li Y, Ran X, Jiang HY, Zhang C, Tan L, Sheng N, Yao YG. Luo R, et al. Signal Transduct Target Ther. 2021 Aug 31;6(1):325. doi: 10.1038/s41392-021-00748-4. Signal Transduct Target Ther. 2021. PMID: 34465723 Free PMC article. - Non-ionotropic voltage-gated calcium channel signaling.
Trus M, Atlas D. Trus M, et al. Channels (Austin). 2024 Dec;18(1):2341077. doi: 10.1080/19336950.2024.2341077. Epub 2024 Apr 11. Channels (Austin). 2024. PMID: 38601983 Free PMC article. Review. - Two Signaling Modes Are Better than One: Flux-Independent Signaling by Ionotropic Glutamate Receptors Is Coming of Age.
Brunetti V, Soda T, Berra-Romani R, De Sarro G, Guerra G, Scarpellino G, Moccia F. Brunetti V, et al. Biomedicines. 2024 Apr 16;12(4):880. doi: 10.3390/biomedicines12040880. Biomedicines. 2024. PMID: 38672234 Free PMC article. Review.
References
- Davies J, Francis AA, Jones AW, Watkins JC. 2-Amino-5-phosphonovalerate (2APV), a potent and selective antagonist of amino acid-induced and synaptic excitation. Neurosci Lett. 1981;21(1):77–81. - PubMed
Publication types
MeSH terms
Substances
LinkOut - more resources
Full Text Sources
Other Literature Sources
Molecular Biology Databases
Miscellaneous
