Dynamics extracted from fixed cells reveal feedback linking cell growth to cell cycle - PubMed (original) (raw)
Dynamics extracted from fixed cells reveal feedback linking cell growth to cell cycle
Ran Kafri et al. Nature. 2013.
Abstract
Biologists have long been concerned about what constrains variation in cell size, but progress in this field has been slow and stymied by experimental limitations. Here we describe a new method, ergodic rate analysis (ERA), that uses single-cell measurements of fixed steady-state populations to accurately infer the rates of molecular events, including rates of cell growth. ERA exploits the fact that the number of cells in a particular state is related to the average transit time through that state. With this method, it is possible to calculate full time trajectories of any feature that can be labelled in fixed cells, for example levels of phosphoproteins or total cellular mass. Using ERA we find evidence for a size-discriminatory process at the G1/S transition that acts to decrease cell-to-cell size variation.
Figures
Figure 1
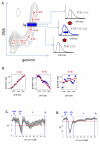
Dynamic information from static data using ERA. (A) Levels of DNA (DAPI) and Geminin (mAG-hGem) in an unsynchronized, exponential population of HeLa cells. The black contour lines denote the distribution, f, of cells within the DNA/Geminin plane. Also shown is the average cell cycle trajectory, I, (red). The different densities of cells in boxes A and B result from the different rates at which cells traverse those regions. (B) The transformation of the cell cycle axis, I, to a real time axis. For convenience we chose 100 units of I to represent a complete path from the beginning of G1 to the end of G2. Comparison of ERA with direct dynamical measurements (C-D). (C) Accumulation of Geminin (mAG-hGem) was followed in 10 individual live cells by time lapse microscopy (blue lines) and compared to the dynamics of mAG-hGem calculated from fixed cells using ERA (red). (D) DNA replication rate was measured by exposing cells to a 20 min. pulse of EdU (5-ethynyl-2′-deoxyuridine, Invitrogen) prior to fixation. Average levels of EdU fluorescence per cell (indicating rate of DNA replication) are plotted (blue) as a function of DAPI, giving a measure of the mean rate of DNA replication as a function of passage through S. For comparison, ERA was used to calculate DNA replication rates directly from fixed cells not treated with EdU (red).
Figure 2
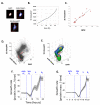
Calculation of growth as a function of cell cycle progression using ERA. (A) Cells were stained and imaged for DNA content (DAPI), the geminin degron (mAG-hGem) and for protein content (succinimidyl ester-Alexa 647 (SE-A647)). (B) Growth during cell cycle progression, computed by ERA. (C) Comparison of SE-A647 fluorescence intensity with quantitative phase microscopy measurements in single cells. Each data point represents a single cell measured for both protein content (SE-647) and phase retardation (QPM). (D) A scatter plot for the levels of DNA (DAPI) Geminin (mAG-hGem) and cell size (SE-A647) in an unsynchronized population of HeLa cells. Also shown is the projection of the 2-dimensional distribution of Geminin and DNA overlaid with I. (E) The 3-dimensional probability distribution from the data shown in 2D (F, G) Growth rate versus time for HeLa (F) and RPE1 (G) calculated by ERA. Confidence intervals are shown as described in Supplementary material.
Figure 3
Rate of cell growth as a function of size and cell cycle. Size discrimination at the G1/S transition. (A) Calculation of growth rate as a function of size for a defined interval, ΔI, on the cell cycle axis, I. To calculate feedback regulation as a function of cell size, the size distributions of cells entering and leaving ΔI are estimated from the sizes of cells on the boundary of ΔI. (B) Plots of growth-rate vs. cell-size at late G1 ( I = 20 ), the G1/S transition ( I = 40) and late S-phase ( I = 80 ). (C,D) The slope, φ, of growth rate vs. cell size plotted as a function of I, for (C), HeLa cells and (D), RPE1 cells. The red horizontal line positioned at φ = 0 is added to emphasize the distinction between positive and negative slopes (positive and negative feedbacks). Blue vertical lines demarcate borders between different stages of cell cycle. Confidence intervals are in gray.
Figure 4
Cell size variability (full width/half maximum) as a function of cell cycle time for HeLa cells incubated for 1hr with (A) 0.001 v/v Dimethylsulfoxide; (B); 1uM cycloheximide; (C ); 10uM G132; M (D) 100nM rapamycin. Confidence intervals are shown in gray.
Similar articles
- Regulation of late G1/S phase transition and APC Cdh1 by reactive oxygen species.
Havens CG, Ho A, Yoshioka N, Dowdy SF. Havens CG, et al. Mol Cell Biol. 2006 Jun;26(12):4701-11. doi: 10.1128/MCB.00303-06. Mol Cell Biol. 2006. PMID: 16738333 Free PMC article. - Apoptosis in erythroid progenitors deprived of erythropoietin occurs during the G1 and S phases of the cell cycle without growth arrest or stabilization of wild-type p53.
Kelley LL, Green WF, Hicks GG, Bondurant MC, Koury MJ, Ruley HE. Kelley LL, et al. Mol Cell Biol. 1994 Jun;14(6):4183-92. doi: 10.1128/mcb.14.6.4183-4192.1994. Mol Cell Biol. 1994. PMID: 8196656 Free PMC article. - An architectural perspective of cell-cycle control at the G1/S phase cell-cycle transition.
Stein GS, van Wijnen AJ, Stein JL, Lian JB, Montecino M, Zaidi SK, Braastad C. Stein GS, et al. J Cell Physiol. 2006 Dec;209(3):706-10. doi: 10.1002/jcp.20843. J Cell Physiol. 2006. PMID: 17001681 Review. - [Involvement of Rho proteins in G1 phase cell cycle progression].
Klimaszewska-Wiśniewska A, Nowak JM, Żuryń A, Grzanka A. Klimaszewska-Wiśniewska A, et al. Postepy Hig Med Dosw (Online). 2013 Jan 11;67:15-25. doi: 10.5604/17322693.1028766. Postepy Hig Med Dosw (Online). 2013. PMID: 23475479 Review. Polish.
Cited by
- Uncoupling of mTORC1 from E2F activity maintains DNA damage and senescence.
Daigh LH, Saha D, Rosenthal DL, Ferrick KR, Meyer T. Daigh LH, et al. Nat Commun. 2024 Oct 24;15(1):9181. doi: 10.1038/s41467-024-52820-6. Nat Commun. 2024. PMID: 39448567 Free PMC article. - Coupling of cell growth modulation to asymmetric division and cell cycle regulation in Caulobacter crescentus.
Glenn S, Fragasso A, Lin WH, Papagiannakis A, Kato S, Jacobs-Wagner C. Glenn S, et al. Proc Natl Acad Sci U S A. 2024 Oct 8;121(41):e2406397121. doi: 10.1073/pnas.2406397121. Epub 2024 Oct 3. Proc Natl Acad Sci U S A. 2024. PMID: 39361646 Free PMC article. - The Hox Gene, abdominal A controls timely mitotic entry of neural stem cell and their growth during CNS development in Drosophila.
Das P, Murthy S, Abbas E, White K, Arya R. Das P, et al. bioRxiv [Preprint]. 2024 Sep 5:2024.09.04.611161. doi: 10.1101/2024.09.04.611161. bioRxiv. 2024. PMID: 39282366 Free PMC article. Preprint. - Stochastic Gene Expression in Proliferating Cells: Differing Noise Intensity in Single-Cell and Population Perspectives.
Zhang Z, Zabaikina I, Nieto C, Vahdat Z, Bokes P, Singh A. Zhang Z, et al. bioRxiv [Preprint]. 2024 Jun 29:2024.06.28.601263. doi: 10.1101/2024.06.28.601263. bioRxiv. 2024. PMID: 38979195 Free PMC article. Preprint. - Eukaryotic cell size regulation and its implications for cellular function and dysfunction.
Chadha Y, Khurana A, Schmoller KM. Chadha Y, et al. Physiol Rev. 2024 Oct 1;104(4):1679-1717. doi: 10.1152/physrev.00046.2023. Epub 2024 Jun 20. Physiol Rev. 2024. PMID: 38900644 Free PMC article. Review.
References
- Mitchison JM. Growth during the cell cycle. Int Rev Cytol. 2003;226:165–258. - PubMed
- Deen WM. Analysis of transport phenomena. 2nd edn Oxford University Press; 2012.
- Sakaue-Sawano A, et al. Visualizing spatiotemporal dynamics of multicellular cell-cycle progression. Cell. 2008;132:487–498. doi:10.1016/j.cell.2007.12.033. - PubMed
- Mitchison JM. The biology of the cell cycle. University Press; 1971. p. 128.
Publication types
MeSH terms
Substances
LinkOut - more resources
Full Text Sources
Other Literature Sources


