Signaling between transforming growth factor β (TGF-β) and transcription factor SNAI2 represses expression of microRNA miR-203 to promote epithelial-mesenchymal transition and tumor metastasis - PubMed (original) (raw)
Signaling between transforming growth factor β (TGF-β) and transcription factor SNAI2 represses expression of microRNA miR-203 to promote epithelial-mesenchymal transition and tumor metastasis
Xiangming Ding et al. J Biol Chem. 2013.
Abstract
TGF-β promotes tumor invasion and metastasis by inducing an epithelial-mesenchymal transition (EMT). Understanding the molecular and epigenetic mechanisms by which TGF-β induces EMT may facilitate the development of new therapeutic strategies for metastasis. Here, we report that TGF-β induced SNAI2 to promote EMT by repressing miR-203. Although miR-203 targeted SNAI2, SNAI2 induced by TGF-β could directly bind to the miR-203 promoter to inhibit its transcription. SNAI2 and miR-203 formed a double negative feedback loop to inhibit each other's expression, thereby controlling EMT. Moreover, we found that miR-203 was significantly down-regulated in highly metastatic breast cancer cells. The restoration of miR-203 in highly metastatic breast cancer cells inhibited tumor cell invasion in vitro and lung metastatic colonization in vivo by repressing SNAI2. Taken together, our results suggest that the SNAI2 and miR-203 regulatory loop plays important roles in EMT and tumor metastasis.
Figures
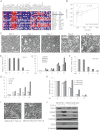
FIGURE 1.
miR-203 in MDCK cells is repressed in TGF-β-induced EMT. A, heat map showing the top 20 candidate genes co-expressed with CDH1 in the NCI60 database. B, the co-expression of CDH1 mRNA and miR-203 in human tumor tissues. The Spearman correlation coefficients and significance levels are indicated. C, phase-contrast microscopy of MDCK cells treated with TGF-β for the indicated days. Scale bar, 50 μm. D, real time RT-PCR showing the CDH1 expression level in MDCK cells treated with TGF-β for the indicated days. E, TGF-β induced the expression of SNAI2, ZEB1, and ZEB2 in MDCK cells. F, TGF-β repressed miR-203 in MDCK cells as determined by TaqMan miRNA assays. G, TGF-β induced the expression of CDH2, VIM, and FN1 in MDCK cells as determined by real time RT-PCR. H, TGF-β repressed miR-200a, miR-200b, and miR-200c in MDCK cells. I, the restoration of miR-203 prevented the morphology change induced by TGF-β. Scale bar, 50 μm. J, the restoration of miR-203 prevented the up-regulation of SNAI2 and the down-regulation of CDH1 induced by TGF-β. Error bars represent S.D.
FIGURE 2.
miR-203 targets SNAI2 and inhibits breast cancer metastasis. A, heat map showing 25 predicted targets that were suppressed by miR-203 through microarray analysis. B, transfection of pre-miR-203 in MDA-MB-231 cells inhibited SNAI2 and induced CDH1 as determined by Western blot and real time RT-PCR, respectively. C, transfection of pre-miR-203 in Hs578T cells inhibited SNAI2 and induced CDH1 as determined by Western blot and real time RT-PCR, respectively. D, miR-203 up-regulated CDH1 by targeting SNAI2. Both MB231/miR-203 cells and MB231/EV cells were transduced with retroviruses expressing SNAI2 without the 3′-UTR or control vector. The expression of SNAI2 was examined by Western blot, and the expression of CDH1 was examined by Western blot and real time RT-PCR. *, p < 0.05; **, p < 0.01. E and F, transfection of pre-miR-203 inhibited breast cancer invasion in both MDA-MD-231 and Hs578T cells as determined by Matrigel invasion assays. The data are mean ± S.D. of two independent experiments preformed in triplicates. G, the restoration of miR-203 in MDA-MB-231 cells inhibited lung metastasis in nude mice. Metastatic tumors were examined by H&E staining. Arrow, metastatic tumor tissues. The graph shows the quantification of the total number of nodules in individual lungs (n = 5). Student's t test was used for the significance calculation. Scale bar, 50 μm. H, the restoration of SNAI2 partially rescued miR-203-mediated inhibition. Error bars represent S.D. micromets, microscopic metastases.
FIGURE 3.
Knockdown of miR-203 induces EMT in MCF7 cells. A, knockdown of miR-203 increased SNAI2 expression and decreased CDH1 expression in MCF7 cells. B, knockdown of miR-203 increased the invasion capability of MCF7 cells. C, knockdown of miR-203 in MDCK cells induced morphological changes. D, knockdown of miR-203 increased SNAI2 and VIM and decreased CDH1 in MDCK cells. Error bars represent S.D.
FIGURE 4.
SNAI2 induces EMT by repressing miR-203. A, overexpression of SNAI2 in MDA-MB-468 cells induced EMT. The expression of CDH1, VIM, and SNAI2 was examined by immunofluorescence staining. MB468/EV, MDA-MB-468 cells expressing empty vector; MB468/SNAI2, MDA-MB-468 cells expressing SNAI2. Scale bar, 50 μm. B, overexpression of SNAI2 induced VIM and inhibited CDH1 by Western blot. C, SNAI2 repressed miR-203 and miR-200s as determined by TaqMan miRNA assays. D, overexpression of SNAI2 induced endogenous SNAI2 as determined by real time RT-PCR. E, knockdown of SNAI2 induced miR-203 in MDA-MD-231 cells. F, the knockdown of SNAI2 induced miR-203 in Hs578T cells. Error bars represent S.D.
FIGURE 5.
SNAI2 directly inhibits miR-203 expression. A, schematic representations of miR-203 gene indicating the CpG island, three E-boxes, putative TSS, and the poly(A) signals. Black bars represent the reported ESTs. The ChIP assay region is shown. A comparative genomic plot shows the conserved regions in the miR-203 gene among human, mouse, and rat. B, SNAI2 inhibited the miR-203 promoter activity. C, SNAI2 inhibited miR-203 transcription through the E-box. The data are mean ± S.D. of three independent experiments. WT, wild type E-box; MUT1, mutant of E-box 1; MUT2, mutant E-box 2; MUT3, mutant E-box 3; MUT1+2, mutant of E-boxes 1 and 2. D, SNAI2 directly bound to the miR-203 promoter by ChIP assays. Error bars represent S.D.
FIGURE 6.
SNAI2 directly inhibits the miR-200 family transcription. A, overexpression of SNAI2 induced the expression of ZEB1 and ZEB2. B, SNAI2 inhibited the promoter activity of miR-200b-200a-429 and miR-200c-141 in 293T cells. The data are mean ± S.D. of two independent experiments. C, SNAI2 bound to the promoter of miR-200b-200a-429. ChIP assays were performed using IgG or anti-HA antibodies. EV, MDA-MB-468 cells expressing empty vector; HA-SNAI2, MDA-MB-468 cells expressing HA-SNAI2. D, SNAI2 bound to the promoter of miR-200c-141 as determined by ChIP assays. Error bars represent S.D.
FIGURE 7.
SNAI2 is required for TGF-β-mediated inhibition of miR-203. A, knockdown of SNAI2 prevented the induction of VIM and ZEB1 and the repression of CDH1 by TGF-β in MDCK cells. B, knockdown of SNAI2 prevented the morphological change induced by TGF-β in MDCK cells. C, knockdown of SNAI2 prevented the inhibition of miR-203 by TGF-β in MDCK cells. D, knockdown of SNAI2 reversed TGF-β-mediated inhibition of the miR-203 promoter activity. E, the restoration of miR-203 attenuated TGF-β inhibition of CDH1 in MDCK cells. EV, MDCK cells expressing empty vector; miR-203, MDCK cells expressing miR-203. F–H, the restoration of miR-203 attenuated TGF-β inhibition of miR-200a, miR-200b, and miR-200c. The data are the mean of three independent experiments. Error bars represent S.D.
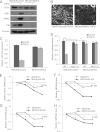
FIGURE 8.
Loss of miR-203 is associated with human tumor metastasis and tumor prognosis. A, loss of miR-203 was associated with human breast cancer metastasis (based on studies reported by Volinia et al. (24)). The p value was calculated by Mann-Whitney U test. x above error bars represents the maximal value; x below error bars represents the minimal value. B, miR-203 was down-regulated in human prostate cancer metastasis (based on studies reported by Taylor et al. (30)). The p value was calculated by Mann-Whitney U test. x above error bars represents the maximal value; x below error bars represents the minimal value. C, Kaplan-Meier curve showing the relapse-free survival of 107 prostate samples with high or low miR-203 expression. The p value was calculated by log rank test. D, a proposed model showing TGF-β signaling, the SNAI2-miR-203 double negative feedback loop, and SNAI2-miR-200-ZEB1/2-CDH1 feed-forward loop in metastasis.
Similar articles
- Estrogen receptor-α-miR-1271-SNAI2 feedback loop regulates transforming growth factor-β-induced breast cancer progression.
Liu BW, Yu ZH, Chen AX, Chi JR, Ge J, Yu Y, Cao XC. Liu BW, et al. J Exp Clin Cancer Res. 2019 Mar 1;38(1):109. doi: 10.1186/s13046-019-1112-4. J Exp Clin Cancer Res. 2019. PMID: 30823890 Free PMC article. - microRNA-33a prevents epithelial-mesenchymal transition, invasion, and metastasis of gastric cancer cells through the Snail/Slug pathway.
Chen DD, Cheng JT, Chandoo A, Sun XW, Zhang L, Lu MD, Sun WJ, Huang YP. Chen DD, et al. Am J Physiol Gastrointest Liver Physiol. 2019 Aug 1;317(2):G147-G160. doi: 10.1152/ajpgi.00284.2018. Epub 2019 Apr 3. Am J Physiol Gastrointest Liver Physiol. 2019. PMID: 30943047 - Regulation of breast cancer metastasis by Runx2 and estrogen signaling: the role of SNAI2.
Chimge NO, Baniwal SK, Little GH, Chen YB, Kahn M, Tripathy D, Borok Z, Frenkel B. Chimge NO, et al. Breast Cancer Res. 2011;13(6):R127. doi: 10.1186/bcr3073. Epub 2011 Dec 9. Breast Cancer Res. 2011. PMID: 22151997 Free PMC article. - Crosstalk between TGF-β signaling and miRNAs in breast cancer metastasis.
Chen W, Zhou S, Mao L, Zhang H, Sun D, Zhang J, Li J, Tang JH. Chen W, et al. Tumour Biol. 2016 Aug;37(8):10011-9. doi: 10.1007/s13277-016-5060-8. Epub 2016 May 6. Tumour Biol. 2016. PMID: 27153853 Review. - RNA regulatory mechanisms controlling TGF-β signaling and EMT in cancer.
Bracken CP, Goodall GJ, Gregory PA. Bracken CP, et al. Semin Cancer Biol. 2024 Jul;102-103:4-16. doi: 10.1016/j.semcancer.2024.06.001. Epub 2024 Jun 23. Semin Cancer Biol. 2024. PMID: 38917876 Review.
Cited by
- Scratch2, a Snail Superfamily Member, Is Regulated by miR-125b.
Goes CP, Vieceli FM, De La Cruz SM, Simões-Costa M, Yan CYI. Goes CP, et al. Front Cell Dev Biol. 2020 Aug 25;8:769. doi: 10.3389/fcell.2020.00769. eCollection 2020. Front Cell Dev Biol. 2020. PMID: 32984310 Free PMC article. - miR-203 facilitates tumor growth and metastasis by targeting fibroblast growth factor 2 in breast cancer.
He S, Zhang G, Dong H, Ma M, Sun Q. He S, et al. Onco Targets Ther. 2016 Oct 11;9:6203-6210. doi: 10.2147/OTT.S108712. eCollection 2016. Onco Targets Ther. 2016. PMID: 27785068 Free PMC article. - Long non-coding RNA UCA1 regulates the expression of Snail2 by miR-203 to promote hepatocellular carcinoma progression.
Xiao JN, Yan TH, Yu RM, Gao Y, Zeng WL, Lu SW, Que HX, Liu ZP, Jiang JH. Xiao JN, et al. J Cancer Res Clin Oncol. 2017 Jun;143(6):981-990. doi: 10.1007/s00432-017-2370-1. Epub 2017 Mar 8. J Cancer Res Clin Oncol. 2017. PMID: 28271214 - TGFβ as a therapeutic target in cystic fibrosis.
Kramer EL, Clancy JP. Kramer EL, et al. Expert Opin Ther Targets. 2018 Feb;22(2):177-189. doi: 10.1080/14728222.2018.1406922. Epub 2017 Dec 13. Expert Opin Ther Targets. 2018. PMID: 29168406 Free PMC article. Review. - Interplay between p53 and non-coding RNAs in the regulation of EMT in breast cancer.
Parfenyev S, Singh A, Fedorova O, Daks A, Kulshreshtha R, Barlev NA. Parfenyev S, et al. Cell Death Dis. 2021 Jan 4;12(1):17. doi: 10.1038/s41419-020-03327-7. Cell Death Dis. 2021. PMID: 33414456 Free PMC article. Review.
References
- Chaffer C. L., Weinberg R. A. (2011) A perspective on cancer cell metastasis. Science 331, 1559–1564 - PubMed
- Thiery J. P. (2002) Epithelial-mesenchymal transitions in tumour progression. Nat. Rev. Cancer 2, 442–454 - PubMed
- Nieto M. A. (2011) The ins and outs of the epithelial to mesenchymal transition in health and disease. Annu. Rev. Cell Dev. Biol. 27, 347–376 - PubMed
- Gumbiner B. M. (2005) Regulation of cadherin-mediated adhesion in morphogenesis. Nat. Rev. Mol. Cell Biol. 6, 622–634 - PubMed
- Perl A. K., Wilgenbus P., Dahl U., Semb H., Christofori G. (1998) A causal role for E-cadherin in the transition from adenoma to carcinoma. Nature 392, 190–193 - PubMed
Publication types
MeSH terms
Substances
Grants and funding
- R01 CA132134/CA/NCI NIH HHS/United States
- R01 DE015964/DE/NIDCR NIH HHS/United States
- R37 DE013848/DE/NIDCR NIH HHS/United States
- R01 DE15964/DE/NIDCR NIH HHS/United States
LinkOut - more resources
Full Text Sources
Other Literature Sources
Medical
Research Materials


