Interplay of LRRK2 with chaperone-mediated autophagy - PubMed (original) (raw)
. 2013 Apr;16(4):394-406.
doi: 10.1038/nn.3350. Epub 2013 Mar 3.
Sheng-Han Kuo, Inmaculada Tasset, Esperanza Arias, Hiroshi Koga, Irene Fernandez-Carasa, Etty Cortes, Lawrence S Honig, William Dauer, Antonella Consiglio, Angel Raya, David Sulzer, Ana Maria Cuervo
Affiliations
- PMID: 23455607
- PMCID: PMC3609872
- DOI: 10.1038/nn.3350
Interplay of LRRK2 with chaperone-mediated autophagy
Samantha J Orenstein et al. Nat Neurosci. 2013 Apr.
Abstract
Mutations in leucine-rich repeat kinase 2 (LRRK2) are the most common cause of familial Parkinson's disease. We found LRRK2 to be degraded in lysosomes by chaperone-mediated autophagy (CMA), whereas the most common pathogenic mutant form of LRRK2, G2019S, was poorly degraded by this pathway. In contrast to the behavior of typical CMA substrates, lysosomal binding of both wild-type and several pathogenic mutant LRRK2 proteins was enhanced in the presence of other CMA substrates, which interfered with the organization of the CMA translocation complex, resulting in defective CMA. Cells responded to such LRRK2-mediated CMA compromise by increasing levels of the CMA lysosomal receptor, as seen in neuronal cultures and brains of LRRK2 transgenic mice, induced pluripotent stem cell-derived dopaminergic neurons and brains of Parkinson's disease patients with LRRK2 mutations. This newly described LRRK2 self-perpetuating inhibitory effect on CMA could underlie toxicity in Parkinson's disease by compromising the degradation of α-synuclein, another Parkinson's disease-related protein degraded by this pathway.
Conflict of interest statement
Conflict of interest: Authors declare no conflict of interest
Figures
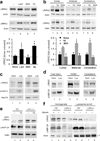
Figure 1. LRRK2 is degraded in lysosomes
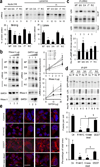
(a) SH-SY5Y cells untreated or incubated with 5µM lactacystin (Lact), 10mM 3-methyladenine (3MA), or 20mM ammonium chloride and 100µM leupeptin (NL) for 9.5 hours. Top: Immunoblots for the indicated proteins. Bottom: Quantification of changes in total levels of LRRK2 (n=6). (b) Brain slices from mouse cortex, midbrain, or cerebellum were incubated without additions or with NL or 3MA for 2 hours at 37°C. Top: Representative immunoblots for the indicated proteins. Bottom: Quantification of changes in levels of LRRK2 relative to those in untreated samples. (n= 3–4). All values are mean+s.e.m. (*p<0.05). (c,d) Homogenate (Hom) and lysosomal fractions (Lys) isolated from SH-SY5Y cells (c) or the indicated mouse brain regions (d) immunoblotted for the indicated proteins. (e) HEK293 cells expressing GFP tagged LRRK2 and transduced with lentivirus control (Ctr) or carrying shRNA against LAMP-2A (L2A(–)) were incubated or not with NL for 12 hours and subjected to immunoblot for the indicated proteins. (f) Immunoblots for LRRK2 and LAMP-2A of homogenates and lysosome-enriched fractions isolated from fibroblasts control (Ctr) or stably interfered for LAMP-2A (L2A(–)) maintained in the presence or absence of serum. Actin and LAMP-1 (L-1) are shown as loading controls of homogenate and lysosomes, respectively. Full-length blots/gels are presented in Supplementary Figure 12.
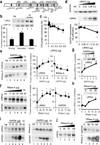
Figure 2. LRRK2 behaves as an atypical CMA substrate
(a) Putative CMA targeting motifs in LRRK2. (b) Starved rat liver lysosomes untreated or pre-treated with protease inhibitors (PI) incubated with LRRK2. Inset: representative immunoblot. LAMP-2A is shown as lysosomal loading control. Inp: input, 1/5 of LRRK2 added. (n= 7). Uptake: difference between LRRK2 associated with lysosomes with and without PI. (c) Effect of increasing concentrations of LRRK2 on the degradation of a radiolabelled pool of cytosolic proteins by intact lysosomes. Values are percentage of the degradation without LRRK2 (n= 5–6). (d) Association of GAPDH to rat liver lysosomes in the presence of increasing concentrations of LRRK2. Values are percentage of GAPDH associated with lysosomes in the absence of LRRK2 (n = 4–6 in duplicate). Inset: representative immunoblot. Inp: 1 µg of GAPDH. (e, f) Association of LRRK2 and RNase A (e) or LRRK2 and GAPDH (f) with PI treated rat liver lysosomes incubated with increasing concentrations of GAPDH (e) or RNase A (f) or ovalbumin (Ov). Left: representative immunoblots. Right: Percentage of protein association when incubated with lysosomes alone (n = 5–6). Inp: RNase A (0.4 µg), LRRK2 (0.04µg) or GAPDH (1 µg). (g,h) Association of LRRK2 to lysosomes incubated with GAPDH (g) or RNase A (h) at 4°C. (n= 3). (i,j) Immunoblots of brain lysosomes incubated with LRRK2 and increasing concentrations of GAPDH (i) or RNase A (j). All values are mean+s.e.m. (differences with lysosomes incubated with the protein alone were significant for *p<0.05). Full-length blots/gels are in Supplementary Figure 12.
Figure 3. Differences in the degradation of wild-type and G2019S mutant LRRK2
(a) Immunoblot for GFP of Tet-on-HEK293 cells expressing GFP-tagged wild-type (WT) or G1209S mutant LRRK2 (G/S) pulsed 24h with doxycycline and 48h later (no longer de novo synthesis), incubated without additions (–) or with 20 mM ammonium chloride and 100 µM leupeptin (NL), 5 µM MG132 (MG), or 10mM 3-methyladenine (3MA). Bottom: Percentage of inhibition (n =3). (b) Cells control (Ctr) or RNAi for LAMP-2A (L2A(–)) pulsed as in a, sequentially collected and immunoblotted for GFP. Left: Representative immunoblot. Actin is shown as a loading control. Quantification is shown at the bottom corrected by levels of knock-down (n = 3–4). Right: Immunoblot for LAMP-2A. Bottom shows the percentage of LRRK2 degraded per hour in the same samples. (c) Starved rat livers lysosomes untreated or pre-treated with protease inhibitors (PI) incubated with WT or G/S LRRK2. Inset: Representative immunoblot. (n = 9). (d) Association of GAPDH (5 µg) to starved rat liver lysosomes in the presence of increasing concentrations of WT or G/S LRRK2. Inset: Representative immunoblot. (n=4–6). (e, f) Binding of WT and G/S LRRK2 to lysosomes in the presence of GAPDH (e) or RNase A (f). Top: Representative immunoblots. Bottom: Lysosome-bound LRRK2 expressed as fold-levels when added alone. Trends of mean values (n=2). (g) Rat brain lysosomes incubated with WT or G/S LRRK2 as in c. Inputs: 1/10 of protein added. (h,i) Rat brain lysosomes incubated as in d and e, respectively. Left: Representative immunoblots. Right: Quantifications (n=3–4). All values are expressed as mean+s.e.m. (differences with untreated samples (*) and between WT and G/S LRRK2 (§) were significant for p<0.05). Full-length blots/gels are in Supplementary Figure 12.
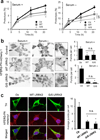
Figure 4. Overexpression of LRRK2 proteins exerts an inhibitory effect on CMA
(a) HEK293 cells stably transfected with an empty plasmid (Ctr) or plasmids expressing wild-type (WT) or G2019S mutant (G/S) LRRK2 under the control of tetracycline, were treated with doxycycline to activate protein expression and then labeled with 3H-leucine for 48h. After extensive washing, protein degradation at the indicated times was measured as the amount of acid precipitable radioactivity (amino acids and small peptides) released into the media. Values are expressed as percentage of radioactivity in proteins (acid precipitable) at time 0 (n=4). (b) The same cells were transiently transfected with a KFERQ-PA-mCherry1 fluorescent reporter for CMA activity. After photoactivation, cells were maintained for 16h in the presence or absence of serum. Left: Representative micrographs. Insets show higher magnification images. Right: Quantification of the average number of puncta per cell in each condition measured in >150 cells. (c) Ventral midbrain dopaminergic neurons from control (Ctr), WT, or G/S LRRK2 transgenic mice were transduced with the same reporter as in b and co-stained with anti-TH. Left: Representative images. Right: Average number of puncta/cell in >50 TH-positive cells. Scale bars: 10 µm Values are all mean+s.e.m. (differences with control (*) and between WT and G/S LRRK2 (§) were significant for p<0.05).
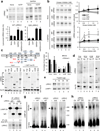
Figure 5. Interplay of LRRK2 with CMA components
(a) Immunoblot (duplicates) of rat liver lysosomes incubated with wild-type (WT) or G2019S mutant (G/S) LRRK2 alone or with 1mM GTP and/or GAPDH. Bottom: Quantification of lysosome-bound LRRK2 expressed as times the binding without additions. (n=6). (b) Effect of kinase inhibitor on WT, G/S, or the kinase-dead mutant D1994A (KiD) LRRK2 incubated with rat liver lysosomes in presence or not of GAPDH (5 µg). Right: Quantification expressed as fold-times the binding without additions. (n=3–5). (c,d) HEK293 cells transiently transfected with the indicated myc-or GFP tagged LRRK2 constructs (see scheme). Full (full length); M (KFERQ motifs (M1–M8)) (c) Binding to GST-hsc70. Lanes 1–6 show 1/10 inputs. NT: non transfected cells. Immunoblot for hsc70 is shown as loading control. Top right: Quantification of LRRK2 bound to hsc70. Where indicated, samples were co-incubated with RNase A to compete the KFERQ-mediated binding of hsc70 (n=3–4). (d) Co-immunoprecipiation (IP) of hsc70 with anti-myc or GFP in the same cells. Inputs (Inp: ¼ of starting volume). (e) Binding or LRRK2 to rat liver lysosomes treated with the indicated concentrations of trypsin. LAMP-1 is shown to confirm the integrity of the lysosomes. (f) Co-immunoprecipiation (IP) of LAMP-2A with anti-LRRK2 in lysosomes incubated with WT or G/S LRRK2. Inp: ¼ of starting sample). IgG: immunoglobulin. Values: LAMP-2A recovered in the IP (IP L2A) corrected for the amount of LRRK2 pulled down and expressed as folds WT. (g, h) LAMP-2A immunoblot of rat liver lysosomes incubated alone (none) or with WT or G/S LRRK2 (g) or lysosomes from control (Ctr) and WT and G/S LRRK2 transgenic mice and subjected to blue native electrophoresis (BNE). Arrow: 700KDa multimeric complex. Duplicates are shown. All values are mean+s.e.m. (differences compared to none or untreated (*) or to full length protein (§) were significant for p<0.05). Full-length blots/gels are in Supplementary Figure 12.
Figure 6. Altered CMA markers in brains of familial LRRK2 PD patients
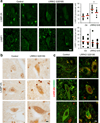
(a) Immunofluorescence for LAMP-2A and LAMP-1 of sections from the dorsal motor nucleus of the vagus nerve of brains from two different unaffected control individuals and two PD individuals with the LRRK2 G2019S mutation. Left: Images from representative fields. Right: Quantification of the number of fluorescent puncta per cell. Black dots show values in individual cells and red marks show the mean value. (b) Immunohistochemistry for LAMP-2A in the same samples. (c) Immunofluorescence for LAMP-2A (red) and LRRK2 (green) in the same samples. Merged images from both fluorophore channels are shown. Scale bar: 10 µm. (for colocalization quantification see Supplementary Fig. 7b). Values are mean+s.e.m. (*p<0.05).
Figure 7. Interaction of additional LRRK2 mutant variants with CMA
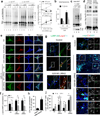
(a) LRRK2 immunoblot of rat liver lysosomes incubated with wild-type (WT), G2019S (G/S), D1994A (D/A, kinase-dead), I2020T (I/T), or R1441C (R/C) mutant LRRK2 alone or in the presence of protease inhibitors (PI) Lanes 1–5: ¼ input. Bottom: Quantification of binding and uptake (n=4–5). (b) Immunoblots of lysosomes incubated as in a alone or in the presence of increasing concentrations of RNase A (left) or GAPDH (right). Right: Quantification of LRRK2 bound as folds of binding when incubated with lysosomes alone. (n=3). (c) Co-immunoprecipitation (Co-IP) of LAMP-2A with anti-LRRK2 from lysosomes incubated with LRRK2 proteins as in a, were subjected to immunoprecipitation with LRRK2. Co-immunoprecipitated fractions (Co-IP) were immunobloted for LAMP-2A and LRRK2. Input: Immunoblot for LAMP-2A before the affinity purification. Bottom: Amount of LAMP-2A co-immunoprecipitated expressed as folds the value in WT-LRRK2. (n=3–4). (d) Co-immunoprecipitation of LAMP-2A with anti-GFP in Tet-on-HEK293 cells expressing GFP-LRRK2 proteins and pulsed for 24 hours with doxycycline. Inputs (Inp: ¼ of added) (e) The same cells as in d and control cells transduced with the KFERQ-PA-mCherry1. Left: Representative images, full field and higher magnification panels. Right: Quantification after photactivation and 16 hours in serum deprived media (n > 150 cells). Values are all mean+s.e.m. (Differences with wild type (*) or with the other mutants (§) were significant for p<0.05). Bars: 10 µM. Full-length blots/gels are in Supplementary Figure 12.
Figure 8. Coincidence of LRRK2 and α-syn at lysosomes enhances their toxic effect on CMA
(a) α-syn immunoblot of rat liver lysosomes incubated with WT or mutant (A53T) α-syn alone (–) or with WT-LRRK2 or G/S MT-LRRK2 (Inp: input). Right: Quantifications of α-syn oligomers expressed as folds levels in samples without LRRK2. (n= 4–5). (b-d) Degradation of radiolabeled proteins (b), binding of GST-α-syn (c) and levels of endogenous α-syn (d) in intact brain lysosomes from control (CT) and G/S LRRK2 transgenic mice. Bottom insert in c shows lower exposure to visualize monomers (Mon) of α-syn. Homog: homogenates; I: input (n=3). (e) Ventral midbrain dopaminergic neuronal cultures from control, or WT or G/S LRRK2 transgenic mice untreated or RNAi for LAMP-2A (L2A(–)). Individual channels and merged images are shown. (f) Colocalization between α-syn and total LAMP-2 from cells in e. (n > 50 TH-positive neurons). Note that levels of total LAMP-2 are not reduced in L2A knock-down cells because of upregulation of LAMP-2B. (g–j) Induced pluripotent stem cells (iPSC) lines from control and G/S LRRK2 mutant PD patients were: (g–h) differentiated for 30 days and immunostained as labeled. (g) Merged channels and magnified green and red channels. Arrowheads: colocalization LAMP-2A/ α-syn. (h) Percentage of LAMP-2A-positive puncta that colocalize with α-syn in TH-positive cells. (n >50) for 2 control and 2 LRRK2 iPSC lines. (i,j) differentiated for 30 or 75 days, and RNAi for LAMP-2A. (i) Immunofluorescence for LAMP-2A and α-syn and GFP expression (light blue). Bottom: Higher magnifications of boxed areas are presented at the bottom. (j) Percentage of TH-positive cells showing cytoplasmic accumulation of α-syn. n≥2 experiments using 2 control and 2 LRRK2 iPSC lines (n > 70 and n >150 TH-positive cells in Ctr and LRRK2, respectively). Scale bars: 10 µm. All values are mean+s.e.m. Differences with WT or control (*) or between the control or knock-down cells (§) are significant for p<0.05). Full-length blots/gels are in Supplementary Figure 12.
Comment in
- Dangerous duet: LRRK2 and α-synuclein jam at CMA.
Yue Z, Yang XW. Yue Z, et al. Nat Neurosci. 2013 Apr;16(4):375-7. doi: 10.1038/nn.3361. Nat Neurosci. 2013. PMID: 23528933 No abstract available.
Similar articles
- Age-dependent accumulation of oligomeric SNCA/α-synuclein from impaired degradation in mutant LRRK2 knockin mouse model of Parkinson disease: role for therapeutic activation of chaperone-mediated autophagy (CMA).
Ho PW, Leung CT, Liu H, Pang SY, Lam CS, Xian J, Li L, Kung MH, Ramsden DB, Ho SL. Ho PW, et al. Autophagy. 2020 Feb;16(2):347-370. doi: 10.1080/15548627.2019.1603545. Epub 2019 Apr 14. Autophagy. 2020. PMID: 30983487 Free PMC article. - The chaperone activity of heat shock protein 90 is critical for maintaining the stability of leucine-rich repeat kinase 2.
Wang L, Xie C, Greggio E, Parisiadou L, Shim H, Sun L, Chandran J, Lin X, Lai C, Yang WJ, Moore DJ, Dawson TM, Dawson VL, Chiosis G, Cookson MR, Cai H. Wang L, et al. J Neurosci. 2008 Mar 26;28(13):3384-91. doi: 10.1523/JNEUROSCI.0185-08.2008. J Neurosci. 2008. PMID: 18367605 Free PMC article. - LRRK2 G2019S Mutation Inhibits Degradation of α-Synuclein in an In Vitro Model of Parkinson's Disease.
Hu D, Niu JY, Xiong J, Nie SK, Zeng F, Zhang ZH. Hu D, et al. Curr Med Sci. 2018 Dec;38(6):1012-1017. doi: 10.1007/s11596-018-1977-z. Epub 2018 Dec 7. Curr Med Sci. 2018. PMID: 30536063 - Genetic analysis of Parkinson's disease-linked leucine-rich repeat kinase 2.
Tong Y, Shen J. Tong Y, et al. Biochem Soc Trans. 2012 Oct;40(5):1042-6. doi: 10.1042/BST20120112. Biochem Soc Trans. 2012. PMID: 22988862 Free PMC article. Review. - Chaperone mediated autophagy to the rescue: A new-fangled target for the treatment of neurodegenerative diseases.
Xilouri M, Stefanis L. Xilouri M, et al. Mol Cell Neurosci. 2015 May;66(Pt A):29-36. doi: 10.1016/j.mcn.2015.01.003. Epub 2015 Feb 25. Mol Cell Neurosci. 2015. PMID: 25724482 Review.
Cited by
- Proteostasis Disturbances and Inflammation in Neurodegenerative Diseases.
Sonninen TM, Goldsteins G, Laham-Karam N, Koistinaho J, Lehtonen Š. Sonninen TM, et al. Cells. 2020 Sep 28;9(10):2183. doi: 10.3390/cells9102183. Cells. 2020. PMID: 32998318 Free PMC article. Review. - Degradation of misfolded proteins in neurodegenerative diseases: therapeutic targets and strategies.
Ciechanover A, Kwon YT. Ciechanover A, et al. Exp Mol Med. 2015 Mar 13;47(3):e147. doi: 10.1038/emm.2014.117. Exp Mol Med. 2015. PMID: 25766616 Free PMC article. Review. - The pallidopyramidal syndromes: nosology, aetiology and pathogenesis.
Kara E, Hardy J, Houlden H. Kara E, et al. Curr Opin Neurol. 2013 Aug;26(4):381-94. doi: 10.1097/WCO.0b013e3283632e83. Curr Opin Neurol. 2013. PMID: 23817214 Free PMC article. Review. - α-Synuclein: Multiple pathogenic roles in trafficking and proteostasis pathways in Parkinson's disease.
Zalon AJ, Quiriconi DJ, Pitcairn C, Mazzulli JR. Zalon AJ, et al. Neuroscientist. 2024 Oct;30(5):612-635. doi: 10.1177/10738584241232963. Epub 2024 Feb 29. Neuroscientist. 2024. PMID: 38420922 Review. - LRRK2 and membrane trafficking: nexus of Parkinson's disease.
Hur EM, Jang EH, Jeong GR, Lee BD. Hur EM, et al. BMB Rep. 2019 Sep;52(9):533-539. doi: 10.5483/BMBRep.2019.52.9.186. BMB Rep. 2019. PMID: 31383252 Free PMC article.
References
- Spillantini M, et al. Alpha-synuclein in Lewy bodies. Nature. 1997;388:839–840. - PubMed
- Balch WE, Morimoto RI, Dillin A, Kelly JW. Adapting proteostasis for disease intervention. Science. 2008;319:916–919. - PubMed
- Anglade P, et al. Apoptosis and autophagy in nigral neurons of patients with Parkinson's disease. Histol Histopathol. 1997;12:25–31. - PubMed
Publication types
MeSH terms
Substances
Grants and funding
- R01 AG021904/AG/NIA NIH HHS/United States
- P50 NS038370/NS/NINDS NIH HHS/United States
- P50 AG008702/AG/NIA NIH HHS/United States
- R37 AG021904/AG/NIA NIH HHS/United States
- K08 NS083738/NS/NINDS NIH HHS/United States
- AG038072/AG/NIA NIH HHS/United States
- P30 AG038072/AG/NIA NIH HHS/United States
- T32AG023475/AG/NIA NIH HHS/United States
- AG08702/AG/NIA NIH HHS/United States
- P01 AG031782/AG/NIA NIH HHS/United States
- T32 AG023475/AG/NIA NIH HHS/United States
- AG031782/AG/NIA NIH HHS/United States
LinkOut - more resources
Full Text Sources
Other Literature Sources
Molecular Biology Databases
Miscellaneous
