Optical control of metabotropic glutamate receptors - PubMed (original) (raw)
doi: 10.1038/nn.3346. Epub 2013 Mar 3.
Carlos Pantoja, Benjamin Gaub, Harald Janovjak, Andreas Reiner, Adam Hoagland, David Schoppik, Brian Kane, Philipp Stawski, Alexander F Schier, Dirk Trauner, Ehud Y Isacoff
Affiliations
- PMID: 23455609
- PMCID: PMC3681425
- DOI: 10.1038/nn.3346
Optical control of metabotropic glutamate receptors
Joshua Levitz et al. Nat Neurosci. 2013 Apr.
Abstract
G protein-coupled receptors (GPCRs), the largest family of membrane signaling proteins, respond to neurotransmitters, hormones and small environmental molecules. The neuronal function of many GPCRs has been difficult to resolve because of an inability to gate them with subtype specificity, spatial precision, speed and reversibility. To address this, we developed an approach for opto-chemical engineering of native GPCRs. We applied this to the metabotropic glutamate receptors (mGluRs) to generate light-agonized and light-antagonized mGluRs (LimGluRs). The light-agonized LimGluR2, on which we focused, was fast, bistable and supported multiple rounds of on/off switching. Light gated two of the primary neuronal functions of mGluR2: suppression of excitability and inhibition of neurotransmitter release. We found that the light-antagonized tool LimGluR2-block was able to manipulate negative feedback of synaptically released glutamate on transmitter release. We generalized the optical control to two additional family members: mGluR3 and mGluR6. This system worked in rodent brain slices and in zebrafish in vivo, where we found that mGluR2 modulated the threshold for escape behavior. These light-gated mGluRs pave the way for determining the roles of mGluRs in synaptic plasticity, memory and disease.
Figures
Figure 1
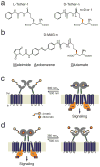
Design of photoswitches for light-control of mGluR2. (a) Chemical structure of tether models including previously described L-Tether-1 and new 4-D versions with two different linker lengths (D-Tether-0 and D-Tether-1) (b) Structure of D-MAG molecules. 380 nm light maximally isomerizes to the cis state, whereas 500 nm light isomerizes to the trans state. Spontaneous thermal relaxation from cis to trans occurs over tens of minutes at room temperature. (c) Schematic view of light-induced agonism. mGluRs contain a ligand-binding clamshell domain (LBD; grey) that is coupled to a 7-transmembrane domain (TMD; green) by a cysteine rich domain (CRD, dark blue). Agonist binding to the LBD initiates clamshell closure, which rearranges a dimer interface with a partner LBD of a second subunit and transmits a conformational change via the TMD to the cytoplasmic domain, thereby activating G-proteins. Under 380 nm illumination D-MAG enters the cis state and reorients the glutamate moiety into the ligand binding site to drive clamshell closure and activate G protein and downstream signaling. (d) Schematic of 380 nm-induced antagonism. Glutamate (dark orange circles) is shown in the bound, activated state of mGluR2. Upon photoisomerization the glutamate end of MAG enters the binding site and prevents clamshell closure, thus deactivating the receptor.
Figure 2
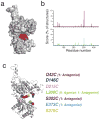
Monte Carlo simulations and cysteine-scanning of mGluR2 ligand-binding domain. (a) _cis_-D-MAG-0 (red stick depiction) with glutamate end bound in LBD (gray surface depiction) is shown in 20 superposed conformations calculated by Monte Carlo simulation using homology model of the mGluR2 LBD in the open, glutamate-bound conformation. (b) Results of D-MAG-0 simulations for cis and trans conformations. Lines indicate the frequency with which the maleimide end of MAG approaches within 6Å of the Cα of a particular residue in the cis state (purple) and trans state (green). (c) Open homology model of mGluR2 LBD showing native side chains of 7 residues individually substituted to cysteine. Results of photoswitching of D-MAG-0 and D-MAG-1 attached at each of the positions where any photoresponse was observed are shown in parentheses. “0” indicates D-MAG-0 and “1” indicates D-MAG-1. Data from ≥2 different coverslips for all conditions tested.
Figure 3
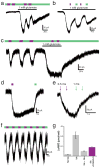
Photo-antagonism and photo-agonism of mGluR2. (a–f) Effects of photoswitching D-MAG0 and D-MAG1 on the activation of GIRK1 current in HEK293 cells. (a) When D-MAG-1 is attached to S302C (“LimGluR2-block”) light has no effect in the absence of glutamate, but 380 nm light evokes photo-antagonism in the presence of glutamate. Black bars indicate application of 1 mM L-glutamate. Green bars indicate illumination with 500 nm light and purple bars indicate 380 nm light. (b) LimGluR2-block photo-antagonism is bistable. A brief flash of 380 nm induces a decrease in glutamate-evoked current which is sustainted in the dark until it is reversed by 500 nm. (c) When D-MAG-0 is attached to L300C 380 nm light evokes GIRK1 current on its own. The current remains activated until deactivation is initiated by 500 nm light. No photo-antagonism is seen in the presence of glutamate, indicating that D-MAG-0 is not a partial agonist of mGluR2- L300C. (d) LimGluR2-mediated GIRK1 current shows sustained response in the dark following a brief illumination at 380. (e) At higher light intensities (~40 W/mm2), 0.5 ms 380 nm pulses can activate and 1 ms 500 nm pulses can fully deactivate LimGluR2. The second 380 nm pulse shows minor further activation, indicating that the first pulse almost completely activated the receptors. (f) GIRK1 current evoked by repetitive rounds of photo-activation and photo-deactivation of mGluR2-L300C-D-MAG-0 (“LimGluR2”) by pulses of 380 nm and 500 nm light, respectively. (g) LimGluR2 activation reduces cAMP elevation induced by a 10 minute application of 10 μM forskolin with similar to the efficacy to 1 mM glutamate application. Error bars show s.e.m. for n=3 coverslips per condition.
Figure 4
Extension of photoswitching from mGluR2 to mGluR3 and mGluR6. (a) Local alignment of region containing D-MAG-0 anchoring sites in mGluR2 for LimGluR2 (red). (b) When D-MAG-0 is attached to mGluR3-Q306C (“LimGluR3”) robust 380 nm-induced agonism is seen. Similar to LimGluR2, no photo-antagonism was seen in the presence of glutamate. (c) When D-MAG-0 is attached to mGluR6-K306C (“LimGluR6-block”) robust 380 nm-induced photoantagonism is seen, indicating that the PTL approach can be extended to group III mGluRs.
Figure 5
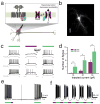
LimGluR2 hyperpolarizes and reduces excitability in cultured hippocampal neurons. (a) Schematic showing LimGluR2 mediated control of excitability via GIRK channels. Note: Light is applied to entire field of view. (b) LimGluR2-eGFP is widely distributed in cultured hippocampal neuron. Scale = 50 μm. (c) Representative cell shows trains of spikes elicited by depolarizing current steps (gray traces) when LimGluR2 is off (500 nm illumination, green bar) are reversibly suppressed by activation of LimGluR2 (380 nm illumination, violet bar). (d) Summary of current step experiments shown in (C) for 8 cells. Bars indicate number of spikes in response to 2 s current injections under 380 nm (violet bar) or 500 nm (green bar) light and error bars indicate s.e.m. Star indicates statistical significance (paired, 1-tailed t-test, p=0.009, 0.004, and 0.009, respectively, for currents of 10, 20, and 30 pA; n=7 cells). (e, f) Representative cells show bistability and repeatability of LimGluR2. (e) LimGluR2-mediated hyperpolarization in representative cell in response to brief (1 s) activation by 380 nm light (violet bar) persists for tens of seconds in the dark before LimGluR2 deactivation by 500 nm light (green bar). The persistent activation in the dark effectively suppresses spikes**. (f)** Representative trace shows repeatable spike silencing by photocontrol of LimGluR2.
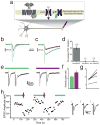
Figure 6
Optical activation of LimGluR2 reversibly decreases excitatory and inhibitory postsynaptic currents and increases paired pulse facilitation at hippocampal autapses. (a) Schematic shows optical control of neurotransmitter release via LimGluR2 triggered G-protein suppression of opening of a presynaptic voltage-gated calcium channel (VGCC). (b, c) Representative autaptic excitatory (b) and inhibitory (c) postsynaptic currents elicited by short (2 ms) depolarizing steps are decreased in amplitude by LimGluR2 activation by 380 nm light (violet traces) compared to deactivation by 500 nm light (green traces. (d) Pooled inhibition of EPSCs and IPSCs by optical activation of LimGluR2 compared to controls in which mGluR2 (L300C) was expressed but not labeled with D-MAG-0 and where mGluR2 was not expressed. Values in parentheses denote number of cells tested and error bars show s.e.m. (e) Representative single sweeps of paired pulse recordings (50 ms inter-stimulus interval) of EPSCs under 500 nm light (green bar) followed by 380 nm light (violet bar). (f) Summary of paired pulse ratio (PPR) values for representative cell. 380 nm light (violet bar) significantly increased the PPR compared to 500 nm light (green bar) (n=10 sweeps/condition; paired, 1-tailed t-test, p=0.008).Error bars show s.e.m.(g) Plot of average PPRs measured for 5 autaptic cells under 500 nm light (green symbols) and 380 nm light (violet symbols). (h) Representative EPSC amplitudes from a cell showing repeatable, bistable optical inhibition of an excitatory autapse. Illumination at 500 nm to deactivate LimGluR2 is followed by brief (1 s) illumination at 380 nm (violet arrows) followed by a period of darkness until illumination at 500 nm to deactivate LimGluR2 was resumed. Inserts (i), (ii), and (iii) show EPSCs from indicated times.
Figure 7
LimGluR2-mediated control of neuronal excitability in hippocampal slice. (a) Hyperpolarization is triggered by illumination at 390 nm (violet bar) and reversed by illumination at 500 nm (green bar) in a representative cell. (b) Representative cell recorded in whole-cell patch in cultured hippocampal slice shows spike firing in response to 1s, 200 pA depolarizing current injections during 500 nm (green bars) or 380 nm (violet bar) illumination. LimGluR2 activation reversibly decreases the number of spikes. (c) Summary of optical control of spike firing in response to current steps in LimGluR2-positive neurons (n=6 cells). Star indicates statistical significance (paired, 1-tailed t-test, p=0.024) and error bars show s.e.m. (e) Representative trace showing reversible, bistable silencing of spontaneous activity by LimGluR2.
Figure 8
Agonism of endogenous group II mGluRs and photo-agonism of LimGluR2 increases escape response probability in zebrafish larvae. (a) Treatment with the group II mGluR agonist L-CCG-1(10 μM) decreases the threshold of the WT zebrafish larvae ASR. The plot shows frequency distribution of minimum energy thresholds. Class >10 Vpp represent fish that had an intact ASR, but that did not respond with a C-bend at the highest sound energy attained by our experimental apparatus (10 Vpp). Comparison of the two groups was performed using the Mann-Whitney test, z = 2.38, p < 0.02, two tailed distribution. ncontrol = nLCCG-1 = 78 fish. (b) UAS-GFP imaging shows pan-neuronal expression in elavl3-GAL4 driver line. Scale=250 μm. (c) Representative larva showing reversible modulation of escape response probability. Each data point represents the escape probability during a period of ten trials. Violet and Green points represent trials after illumination at 510 and 380 nm, respectively. (d) Summary of LimGluR2-modulation of escape response. Green bars indicate illumination with 510 nm light and purple bars indicate 380 nm light. Stars indicate statistical significance (p=0.007 for comparison of 510 nm vs. 380 nm illumination for MAG-labeled larvae with 1-tailed paired T-Test and p=0.03 for comparison of MAG-labeled and unlabeled larvae with 1 tailed unpaired T-Test) and error bars show s.e.m.
Comment in
- Tuning synaptic activity with light-controlled GPCRs.
Pin JP. Pin JP. Nat Neurosci. 2013 Apr;16(4):377-9. doi: 10.1038/nn.3363. Nat Neurosci. 2013. PMID: 23528934 No abstract available.
Similar articles
- [Suppression of neurotransmitter release by presynaptic metabotropic glutamate receptors].
Zhang C, Liu RJ, Qiao JT. Zhang C, et al. Sheng Li Ke Xue Jin Zhan. 2002 Oct;33(4):293-8. Sheng Li Ke Xue Jin Zhan. 2002. PMID: 12650062 Review. Chinese. - Heterologous modulation of inhibitory synaptic transmission by metabotropic glutamate receptors in cultured hippocampal neurons.
Fitzsimonds RM, Dichter MA. Fitzsimonds RM, et al. J Neurophysiol. 1996 Feb;75(2):885-93. doi: 10.1152/jn.1996.75.2.885. J Neurophysiol. 1996. PMID: 8714661 - Group II metabotropic glutamate receptors inhibit glutamate release at thalamocortical synapses in the developing somatosensory cortex.
Mateo Z, Porter JT. Mateo Z, et al. Neuroscience. 2007 May 25;146(3):1062-72. doi: 10.1016/j.neuroscience.2007.02.053. Epub 2007 Apr 6. Neuroscience. 2007. PMID: 17418955 Free PMC article. - Dual optical control and mechanistic insights into photoswitchable group II and III metabotropic glutamate receptors.
Levitz J, Broichhagen J, Leippe P, Konrad D, Trauner D, Isacoff EY. Levitz J, et al. Proc Natl Acad Sci U S A. 2017 Apr 25;114(17):E3546-E3554. doi: 10.1073/pnas.1619652114. Epub 2017 Apr 10. Proc Natl Acad Sci U S A. 2017. PMID: 28396447 Free PMC article. - Glutamate receptors: brain function and signal transduction.
Nakanishi S, Nakajima Y, Masu M, Ueda Y, Nakahara K, Watanabe D, Yamaguchi S, Kawabata S, Okada M. Nakanishi S, et al. Brain Res Brain Res Rev. 1998 May;26(2-3):230-5. doi: 10.1016/s0165-0173(97)00033-7. Brain Res Brain Res Rev. 1998. PMID: 9651535 Review.
Cited by
- Chronic activation of the D156A point mutant of Channelrhodopsin-2 signals apoptotic cell death: the good and the bad.
Perny M, Muri L, Dawson H, Kleinlogel S. Perny M, et al. Cell Death Dis. 2016 Nov 3;7(11):e2447. doi: 10.1038/cddis.2016.351. Cell Death Dis. 2016. PMID: 27809305 Free PMC article. - Translational Retinal Research and Therapies.
Hardcastle AJ, Sieving PA, Sahel JA, Jacobson SG, Cideciyan AV, Flannery JG, Beltran WA, Aguirre GD. Hardcastle AJ, et al. Transl Vis Sci Technol. 2018 Sep 13;7(5):8. doi: 10.1167/tvst.7.5.8. eCollection 2018 Sep. Transl Vis Sci Technol. 2018. PMID: 30225158 Free PMC article. - SNAP-Tagged Nanobodies Enable Reversible Optical Control of a G Protein-Coupled Receptor via a Remotely Tethered Photoswitchable Ligand.
Farrants H, Gutzeit VA, Acosta-Ruiz A, Trauner D, Johnsson K, Levitz J, Broichhagen J. Farrants H, et al. ACS Chem Biol. 2018 Sep 21;13(9):2682-2688. doi: 10.1021/acschembio.8b00628. Epub 2018 Sep 7. ACS Chem Biol. 2018. PMID: 30141622 Free PMC article. - Genetically Targeted Optical Control of an Endogenous G Protein-Coupled Receptor.
Donthamsetti PC, Broichhagen J, Vyklicky V, Stanley C, Fu Z, Visel M, Levitz JL, Javitch JA, Trauner D, Isacoff EY. Donthamsetti PC, et al. J Am Chem Soc. 2019 Jul 24;141(29):11522-11530. doi: 10.1021/jacs.9b02895. Epub 2019 Jul 10. J Am Chem Soc. 2019. PMID: 31291105 Free PMC article. - Synapses in the spotlight with synthetic optogenetics.
Berlin S, Isacoff EY. Berlin S, et al. EMBO Rep. 2017 May;18(5):677-692. doi: 10.15252/embr.201744010. Epub 2017 Apr 10. EMBO Rep. 2017. PMID: 28396573 Free PMC article. Review.
References
- Pierce KL, Premont RT, Lefkowitz RJ. Seven-transmembrane receptors. Nat Rev Mol Cell Biol. 2002;3:639–50. - PubMed
Publication types
MeSH terms
Substances
Grants and funding
- R01 GM085357/GM/NIGMS NIH HHS/United States
- PN2 EY018241/EY/NEI NIH HHS/United States
- PN2EY018241/EY/NEI NIH HHS/United States
- S10 RR028971/RR/NCRR NIH HHS/United States
- R01HL109525/HL/NHLBI NIH HHS/United States
LinkOut - more resources
Full Text Sources
Other Literature Sources
Molecular Biology Databases
