Effects of genetic drift and gene flow on the selective maintenance of genetic variation - PubMed (original) (raw)
Effects of genetic drift and gene flow on the selective maintenance of genetic variation
Bastiaan Star et al. Genetics. 2013 May.
Abstract
Explanations for the genetic variation ubiquitous in natural populations are often classified by the population-genetic processes they emphasize: natural selection or mutation and genetic drift. Here we investigate models that incorporate all three processes in a spatially structured population, using what we call a construction approach, simulating finite populations under selection that are bombarded with a steady stream of novel mutations. As expected, the amount of genetic variation compared to previous models that ignored the stochastic effects of drift was reduced, especially for smaller populations and when spatial structure was most profound. By contrast, however, for higher levels of gene flow and larger population sizes, the amount of genetic variation found after many generations was greater than that in simulations without drift. This increased amount of genetic variation is due to the introduction of slightly deleterious alleles by genetic drift and this process is more efficient when migration load is higher. The incorporation of genetic drift also selects for fitness sets that exhibit allele-frequency equilibria with larger domains of attraction: they are "more stable." Moreover, the finiteness of populations strongly influences levels of local adaptation, selection strength, and the proportion of allele-frequency vectors that can be distinguished from the neutral expectation.
Figures
Figure 1
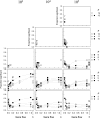
The number of alleles (n) maintained after 10,000 generations as a function of gene flow (m) for three different total population sizes (N). Results are shown for (A) all alleles, (B) common alleles (i.e., with frequencies >5%), and (C) rare alleles (i.e., with frequencies <5%). Standard errors are small (<0.07) and omitted for clarity. The solid symbols indicate the results for populations with genetic drift whereas the open symbols indicate those without. The letter S on the _x_-axis indicates the results for single-deme populations.
Figure 2
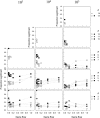
The level of mean fitness (w–) after 10,000 generations as a function of gene flow for three different total population sizes (N). Standard errors are small (<0.01) and omitted for clarity. The solid symbols indicate the results for populations with random drift whereas the open symbols indicate those without. The letter S on the _x_-axis indicates the results for single-deme populations. Only combinations of N, m, and n are shown for which at least 10 replicates were found.
Figure 3
The level of selection strength (s) for all genotypes after 10,000 generations as a function of gene flow for three different total population sizes (N) and n > 1. Standard errors are small (<0.012) and omitted for clarity. The solid symbols indicate the results for populations with random drift whereas the open symbols indicate those without. The letter S on the _x_-axis indicates the results for single-deme populations. Only combinations of N, m, and n are shown for which least 10 replicates were found.
Figure 4
The proportion of allele-frequency vectors sampled from one of the demes that were significantly different from neutral according to the Ewens–Watterson test for neutrality as a function of gene flow for three different population sizes N and n > 1. The solid symbols indicate the results for populations with random drift whereas the open symbols indicate those without. Allele-frequency vectors were rejected if 18 or more of the generated sample homozygosity (F^) values were outside the critical range of Ewens sampling distribution (see text for explanation). The letter S on the _x_-axis indicates the results for single-deme populations. Only combinations of N, m, and n are shown for which least 10 replicates were found.
Figure 5
The proportion of pooled allele-frequency vectors that were significantly different from neutral according to the Ewens–Watterson test for neutrality as a function of gene flow for three different population sizes N and n > 1. The solid symbols indicate the results for populations with random drift whereas the open symbols indicate those without. Allele-frequency vectors were rejected if 18 or more of the generated sample homozygosity (F^) values were outside the critical range of Ewens sampling distribution (see text for explanation). Only combinations of N, m and n are shown for which at least 10 replicates were found.
References
- Bonneuil N., 2012. Multiallelic polymorphism maintained under unpredictable migration and selection. J. Theor. Biol. 293: 189–196. - PubMed
- Bürger R., 2009. Polymorphism in the two-locus Levene model with nonepistatic directional selection. Theor. Popul. Biol. 76: 214–228. - PubMed
- Ewens W. J., 1972. Sampling theory of selectively neutral alleles. Theor. Popul. Biol. 3: 87–112. - PubMed
- Felsenstein J., 1976. The theoretical population genetics of variable selection and migration. Annu. Rev. Genet. 10: 253–280. - PubMed
- Gentle J. E., 2003. Random Number Generation and Monte Carlo Methods. Springer-Verlag, New York.
Publication types
MeSH terms
LinkOut - more resources
Full Text Sources
Other Literature Sources
Research Materials
Miscellaneous


