Chip in a lab: Microfluidics for next generation life science research - PubMed (original) (raw)
Chip in a lab: Microfluidics for next generation life science research
Aaron M Streets et al. Biomicrofluidics. 2013 Jan.
Abstract
Microfluidic circuits are characterized by fluidic channels and chambers with a linear dimension on the order of tens to hundreds of micrometers. Components of this size enable lab-on-a-chip technology that has much promise, for example, in the development of point-of-care diagnostics. Micro-scale fluidic circuits also yield practical, physical, and technological advantages for studying biological systems, enhancing the ability of researchers to make more precise quantitative measurements. Microfluidic technology has thus become a powerful tool in the life science research laboratory over the past decade. Here we focus on chip-in-a-lab applications of microfluidics and survey some examples of how small fluidic components have provided researchers with new tools for life science research.
Figures
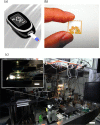
Figure 1
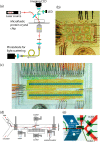
(a) Illustration of generic hand held digital glucose meter. (b) A microfluidic paper-based analytical device (μPAD) Reprinted with permission from A. W. Martinez, S. T. Phillips, G. M. Whitesides, and E. Carrilho, Anal. Chem. 82(1), 3–10 (2010). Copyright 2010 American Chemical Society. (c) A microfluidic chip (inset) in a laboratory. The scale bars are 10 cm and 1 cm (inset).
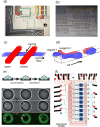
Figure 2
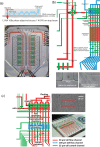
(a) A microfluidic formulation device for high throughput solubility screening of proteins. The primary element is a mixing ring. Peristaltic pumps (in red) inject protein and precipitant into ring and yellow pumps mix the contents of the ring. Reprinted with permission from C. L. Hansen, M. O. A. Sommer, and S. R. Quake, Proc. Natl. Acad. Sci. USA 101(40), 14431–14436 (2004). Copyright 2004 National Academy of Sciences, USA. (b) A free interface diffusion based mixing array for protein crystal screening similar to the device used in Refs. , . (c) A simplified illustration of two microfluidic valves creating a chamber. Typical channels are on the order of 100 _μ_m. Chambers defined in the flow channel by two such valves can be on the order of 100 pl. (d) An emulsion generator using cross flow to shear droplets from the “Y” junction. The two reagents will eventually mix diffusively. (e) A diagram and micrograph showing bacterial confinement in droplets. Green arrows point to bacteria which initiated quorum sensing. Reprinted with permission from J. Q. Boedicker, M. E. Vincent, and R. F. Ismagilov, Angew. Chem., Int. Ed. Engl. 48(32), 5908–5911 (2009). Copyright 2009 Wiley-VCH Verlag GmbH & Co. KGaA, Weinheim. (f) A two-layered microfluidic device for trapping, lysing, and amplifying the genetic material ofsingle cells. Reprinted with permission from Y. Marcy, C. Ouverney, E. M. Bik, T. Losekann, N. Ivanova, H. G. Martin, E. Szeto, D. Platt, P. Hugenholtz, D. A. Relman, and S. R. Quake, Proc. Natl. Acad. Sci. USA 104(29), 11889–11894 (2007). Copyright 2007 National Academy of Sciences, USA.
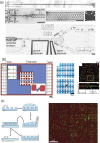
Figure 3
(a) A microfluidic mixing device for high throughput single molecule measurements (left). FRET labeled single stranded DNA is mixed with its complimentary molecule or various salts to measure conformational response. A 3D conformation map is constructed through sequential titration of reagents and automated data collection (right). Reprinted with permission from S. Kim, A. M. Streets, R. R. Lin, S. R. Quake, S. Weiss, and D. S. Majumdar, Nat. Methods 8(3), 242–245 (2011). (b)Ultra-high density digital PCR chip with 36-femtoliter microwells. The illustration depicts the experimental setup for thermal cycling the device. Reprinted with permission from Y. Men, Y. Fu, Z. Chen, P. A. Sims, W. J. Greenleaf, and Y. Huang, Anal. Chem. 84(10), 4262–4266 (2012). Copyright 2012 American Chemical Society. (c) Optical micrograph of microfluidic very large scale integration. These valve arrays are made of channels with cross section of 8 and 6 _μ_m. Reprinted with permission from I. E. Araci and S. R. Quake, Lab Chip 12(16), 2803–2806 (2012). Copyright 2012 by the Royal Society of Chemistry.
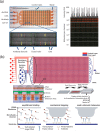
Figure 4
(a) Picoliter emulsion generator, transfer line, and sorter. Reprinted with permission from J. J. Agresti, E. Antipov, A. R. Abate, K. Ahn, A. C. Rowat, J. C. Baret, M. Marquez, A. M. Klibanov, A. D. Griffiths, and D. A. Weitz, Proc. Natl. Acad. Sci. USA 107(9), 4004–4009 (2010). (b) Megapixel digital PCR array. After chambers are filled, they are isolated by flowing an immiscible liquid down the connecting fluid lines preventing molecules from diffusing between chambers. The micrograph shows the imaged array after amplification. Reprinted with permission from K. A. Heyries, C. Tropini, M. Vaninsberghe, C. Doolin, O. I. Petriv, A. Singhal, K. Leung, C. B. Hughesman, and C. L. Hansen, Nat. Methods 8(8), 649–651 (2011). Copyright 2011 Macmillan Publishers Ltd. (c) Process for microengraving (left). A dilute cell suspension is dropped onto the microwell array for cell sequestering. This array is used to print secreted antibodies onto a pre-coated slide. The scanned micrograph displays the resulting microengraved array with fluorescently detected spots (right). Reprinted with permission from J. C. Love, J. L. Ronan, G. M. Grotenbreg, A. G. van der Veen, and H. L. Ploegh, Nat. Biotechnol. 24(6), 703–707 (2006). Copyright 2006 Macmillan Publishers Ltd.
Figure 5
(a) Single cell barcoding chip (SCBC) (left). The chip is aligned with a pre-printed DNA bar code (not shown). After conversion to antibody bar code and incubation with single cells the chip is removed and the bar code array is scanned (right). Reprinted with permission from C. Ma, R. Fan, H. Ahmad, Q. Shi, B. Comin-Anduix, T. Chodon, R. C. Koya, C. C. Liu, G. A. Kwong, C. G. Radu, A. Ribas, and J. R. Heath, Nat. Med. 17(6), 738–743 (2011). Copyright 2011 Macmillan Publishers Ltd. (b) Mechanically induced trapping of molecular interactions (MITOMI) chip (top). Optical micrograph inset shows the button and incubation chamber pair. The chip preparation pipeline and button action are illustrated below. Reprinted with permission from S. J. Maerkl and S. R. Quake, Science 315(5809), 233–237 (2007). Copyright 2007 AAAS.
Figure 6
(a) Schematic diagram of integrated dynamic light scattering and microscopy for microfluidic-based protein crystal growth studies from Ref. . (b) Photograph of the microchemostat. Reprinted with permission from F. K. Balagadde, L. You, C. L. Hansen, F. H. Arnold, and S. R. Quake, Science 309(5731), 137–140 (2005). Copyright 2005 AAAS. (c) Photograph of the cell culture chip used in Ref. courtesy of R. Gomez-Sjoberg. (d) Diagram of chip for C. elegan trapping, imaging, and sorting used in Ref. . Reprinted with permission from C. B. Rohde, F. Zeng, R. Gonzalez-Rubio, M. Angel, and M. F. Yanik, Proc. Natl. Acad. Sci. USA 104(35), 13891–13895 (2007). Copyright 2007 National Academy of Sciences, USA. (e) Optical micrograph of C. elegan immobilization chamber in the device described in Refs. , . Reprinted with permission from K. Chung, M. M. Crane, and H. Lu, Nat. Methods 5(7), 637–643 (2008). Copyright 2008 Macmillan Publishers Ltd.
Figure 7
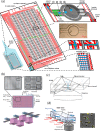
(a) Diagram of laser trap sorting of single cells. This is a two layer “push-up” device and the laser trap drags the cell past two open valves and then into the lysis chamber. (Below)An optical micrograph of the whole device which was used in Refs. , , , . Device was fabricated by the Stanford microfluidic foundry staff. Figure courtesy of P. Blainey. (b) Device schematic for single chromosome sequencing. Red and blue lines represent the flow channels and green are the control. Single cells are trapped in the cross-junction, lysed in the following chamber and then chromosomes are separated into the sequential channels. Optical micrographs (bottom) depict a single metaphase cell in the channel and its chromosomes after lysis. Reprinted with permission from H. C. Fan, J. Wang, A. Potanina, and S. R. Quake, Nat. Biotechnol. 29(1), 51–57 (2011). Copyright 2011 Macmillan Publishers Ltd. (c) Device schematic for the single sperm sequencing chip used in Ref. . Optical micrograph depicts a single sperm cell trapped a flow channel. Reprinted with permission from J.Wang, H. C. Fan, B. Behr, and S. R. Quake, Cell 150(2), 402–412 (2012). Copyright 2012 Elsevier.
Figure 8
(a) Device schematic of the programmable droplet based reaction array used in Ref. . Droplets from 8 reagent inputs are directed to an array address and merged with other droplets to form a desired reaction. Reprinted with permission from K. Leung, H. Zahn, T. Leaver, K. M. Konwar, N. W. Hanson, A. P. Page, C. C. Lo, P. S. Chain, S. J. Hallam, and C. L. Hansen, Proc. Natl. Acad. Sci. USA 109(20), 7665–7670 (2012). (b) Chamber array chip for high density culture of non-adherent mammalian cells. Micrographs (top) show chamber array with single cells. Reprinted with permission from V. Lecault, M. Vaninsberghe, S. Sekulovic, D. J. Knapp, S. Wohrer, W. Bowden, F. Viel, T.McLaughlin, A. Jarandehei, M. Miller, D. Falconnet, A. K. White, D. G. Kent, M. R. Copley, F. Taghipour, C. J. Eaves, R. K. Humphries, J. M. Piret, and C. L. Hansen, Nat. Methods 8(7), 581–586 (2011). Copyright 2011 Macmillan Publishers Ltd. (c) Experimental setup for single molecule gene expression studies in single cells. Two control channels define nanoliter cell confinement. Reprinted with permission from L. Cai, N. Friedman, and X. S. Xie, Nature 440(7082), 358–362 (2006). Copyright 2006 Macmillan Publishers Ltd. (d) Experimental setup for proteome and transcriptome profiling. Different strains of engineered bacteria are monitored in parallel flow channels. Micrograph (right) depicts gene expression observation in single bacteria. Reprinted with permission from Y. Taniguchi, P. J. Choi, G. W. Li, H. Chen, M. Babu, J. Hearn, A. Emili, and X. S. Xie, Science 329(5991), 533–538 (2010). Copyright 2010 AAAS.
Similar articles
- Logic digital fluidic in miniaturized functional devices: Perspective to the next generation of microfluidic lab-on-chips.
Zhang Q, Zhang M, Djeghlaf L, Bataille J, Gamby J, Haghiri-Gosnet AM, Pallandre A. Zhang Q, et al. Electrophoresis. 2017 Apr;38(7):953-976. doi: 10.1002/elps.201600429. Epub 2017 Feb 21. Electrophoresis. 2017. PMID: 28059451 Review. - Challenges and opportunities in micro/nanofluidic and lab-on-a-chip.
Verma N, Pandya A. Verma N, et al. Prog Mol Biol Transl Sci. 2022;186(1):289-302. doi: 10.1016/bs.pmbts.2021.07.016. Epub 2021 Jul 31. Prog Mol Biol Transl Sci. 2022. PMID: 35033289 - Microfluidics in Biotechnology: Quo Vadis.
Winkler S, Grünberger A, Bahnemann J. Winkler S, et al. Adv Biochem Eng Biotechnol. 2022;179:355-380. doi: 10.1007/10_2020_162. Adv Biochem Eng Biotechnol. 2022. PMID: 33495924 - Microfluidics for Environmental Applications.
Wang T, Yu C, Xie X. Wang T, et al. Adv Biochem Eng Biotechnol. 2022;179:267-290. doi: 10.1007/10_2020_128. Adv Biochem Eng Biotechnol. 2022. PMID: 32440697 Review. - Microfluidic lab-on-a-chip platforms: requirements, characteristics and applications.
Mark D, Haeberle S, Roth G, von Stetten F, Zengerle R. Mark D, et al. Chem Soc Rev. 2010 Mar;39(3):1153-82. doi: 10.1039/b820557b. Epub 2010 Jan 25. Chem Soc Rev. 2010. PMID: 20179830 Review.
Cited by
- A smartphone serves as a data logger for a fully automated lab-constructed microfluidic system.
Aboud MN, Al-Sowdani KH. Aboud MN, et al. MethodsX. 2024 Jan 23;12:102584. doi: 10.1016/j.mex.2024.102584. eCollection 2024 Jun. MethodsX. 2024. PMID: 38313696 Free PMC article. - Lipid coated liquid crystal droplets for the on-chip detection of antimicrobial peptides.
Bao P, Paterson DA, Harrison PL, Miller K, Peyman S, Jones JC, Sandoe J, Evans SD, Bushby RJ, Gleeson HF. Bao P, et al. Lab Chip. 2019 Mar 13;19(6):1082-1089. doi: 10.1039/c8lc01291a. Lab Chip. 2019. PMID: 30785139 Free PMC article. - Thermal sensing in fluid at the micro-nano-scales.
Yang F, Yang N, Huo X, Xu S. Yang F, et al. Biomicrofluidics. 2018 Jul 2;12(4):041501. doi: 10.1063/1.5037421. eCollection 2018 Jul. Biomicrofluidics. 2018. PMID: 30867860 Free PMC article. Review. - micrIO: an open-source autosampler and fraction collector for automated microfluidic input-output.
Longwell SA, Fordyce PM. Longwell SA, et al. Lab Chip. 2020 Jan 7;20(1):93-106. doi: 10.1039/c9lc00512a. Epub 2019 Nov 8. Lab Chip. 2020. PMID: 31701110 Free PMC article. - Editorial: Moving on in biomicrofluidics.
Chang HC, Yeo L. Chang HC, et al. Biomicrofluidics. 2013 Jan;7(1):10401. doi: 10.1063/1.4775344. Epub 2013 Jan 31. Biomicrofluidics. 2013. PMID: 23460771 Free PMC article. No abstract available.
References
- Manz A., Graber N., and Widmer H. M., Sens. Actuators B 1(1–6), 244–248 (1990).10.1016/0925-4005(90)80209-I - DOI
LinkOut - more resources
Full Text Sources
Other Literature Sources
Miscellaneous
