Characterization of the TGF-β1 signaling abnormalities in the Gata1low mouse model of myelofibrosis - PubMed (original) (raw)
Comparative Study
. 2013 Apr 25;121(17):3345-63.
doi: 10.1182/blood-2012-06-439661. Epub 2013 Mar 5.
Fabrizio Martelli, Fiorella Ciaffoni, Francesca Masiello, Barbara Ghinassi, Emanuela D'Amore, Margherita Massa, Giovanni Barosi, Laura Sancillo, Xiaochun Li, Judith D Goldberg, Rosa Alba Rana, Anna Rita Migliaccio
Affiliations
- PMID: 23462118
- PMCID: PMC3637011
- DOI: 10.1182/blood-2012-06-439661
Comparative Study
Characterization of the TGF-β1 signaling abnormalities in the Gata1low mouse model of myelofibrosis
Maria Zingariello et al. Blood. 2013.
Abstract
Primary myelofibrosis (PMF) is characterized by fibrosis, ineffective hematopoiesis in marrow, and hematopoiesis in extramedullary sites and is associated with abnormal megakaryocyte (MK) development and increased transforming growth factor (TGF)-β1 release. To clarify the role of TGF-β1 in the pathogenesis of this disease, the TGF-β1 signaling pathway of marrow and spleen of the Gata1(low) mouse model of myelofibrosis (MF) was profiled and the consequences of inhibition of TGF-β1 signaling on disease manifestations determined. The expression of 20 genes in marrow and 36 genes in spleen of Gata1(low) mice was altered. David-pathway analyses identified alterations of TGF-β1, Hedgehog, and p53 signaling in marrow and spleen and of mammalian target of rapamycin (mTOR) in spleen only and predicted that these alterations would induce consequences consistent with the Gata1(low) phenotype (increased apoptosis and G1 arrest both in marrow and spleen and increased osteoblast differentiation and reduced ubiquitin-mediated proteolysis in marrow only). Inhibition of TGF-β1 signaling normalized the expression of p53-related genes, restoring hematopoiesis and MK development and reducing fibrosis, neovascularization, and osteogenesis in marrow. It also normalized p53/mTOR/Hedgehog-related genes in spleen, reducing extramedullary hematopoiesis. These data identify altered expression signatures of TGF-β1 signaling that may be responsible for MF in Gata1(low) mice and may represent additional targets for therapeutic intervention in PMF.
Figures
Figure 1
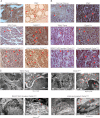
The TGF-β1 content of MKs from PMF patients and Gata1low mice is similarly increased. (A-B) TGF-β1–specific immunohistochemistry of representative BM (A) and spleen (B) sections of one nondiseased donor and one PMF patient, untreated wild-type, or Gata1low mice, and Gata1low mice treated with either SB431245 or vehicle, as indicated. Arrows indicate representative MKs. Human MKs are on average twice as large as murine MKs. Original magnification ×20 (A) and ×40 (B). Quantifications of MK frequency and intensity of TGF-β1 immunostaining for the different groups are presented in Table 1. (C) TGF-β1 immunogold-staining of one representative MK (C1-4) from untreated wild-type and Gata1low mice and from Gata1low mice treated with either SB431245 or vehicle. The selected areas of the MK cytoplasm indicated by rectangles are shown at a higher magnification in C5-8. Arrowheads indicate TGF-β1–specific gold particles. The mean (±SD) number of immunogold-particles/14 μm2 of MK cytoplasm obtained in 5 replicate measurements is indicated below each panel. Values statistically different (P < .05) between untreated wild-type and Gata1low mice and vehicle- and _SB431542_-treated Gata1low mice are indicated by & and *, respectively. Magnification ×4400 in C1-4 and 30 000× in C5-8.
Figure 2
TGF-β, VEGF, and CXCL12 expression is increased in both BM and spleen from wild-type and Gata1low mice and inhibition of TGF-β signaling reduces expression of TGF-β but not that of VEGF or CXCL12. Expression levels were analyzed by quantitative RT-PCR analyses and are normalized to those detected in BM from untreated Gata1low mice. Results are presented as mean (±SD) of 3 independent determinations with 3 mice per experimental point. Values observed in untreated wild-type and Gata1low mice are presented as gray and pink boxes, respectively. Values statistically different (P < .05) between untreated wild-type and Gata1low mice and vehicle- and _SB431542_-treated Gata1low mice are indicated by & and *, respectively. Similar differences in TGF-β expression among the various groups were also detected by microarray profiling and are not included in Table 3, because they were <2-fold, the cutoff that defined differences in expression in this Table.
Figure 3
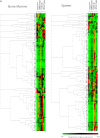
Unique altered expression signatures characterize the TGF-β pathway profiles of BM and spleen of Gata1low mice. (A) Hierarchical clustering of normalized gene expression in BM and spleen from untreated wild-type and Gata1low mice and from Gata1low treated with either vehicle or SB431542, as indicated (each line a different mouse, 3 mice per experimental group). (B) Venn diagram depicting overlap of differentially expressed genes in BM and spleen of untreated Gata1low mice or in Gata1low mice treated with either vehicle or SB431542, as indicated. Only genes with ≥ 2-fold differences in expression levels were considered. For further details, see Table 3. (C) Quantitative RT-PCR determinations of the mRNA levels for Acvrl1, Bmp2, and Igf1 in BM and of Id2, Stat1, and Ltbp1 in spleen of untreated wild-type and Gata1low mice and of Gata1low mice treated with either vehicle or SB431542, as indicated. Results are normalized to those observed in wild-type mice and are presented as mean (±SD) of those observed, with 3 mice per experimental group. Values statistically different (P < .05) from those observed in wild-type or untreated Gata1low mice are indicated with * or &. Differences in gene expression among the 4 experimental groups are similar to those observed by microarray analyses.
Figure 4
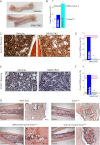
Inhibition of TGF-β1 signaling reduces fibrosis, neo-angiogenesis, and osteogenesis in the BM of Gata1low mice. (A) Morphological appearance of a femur (original magnification ×1.5), (B) BM cellularity, and representative (C-D) reticulinic fiber determinations by Gomori-Silver and (E,F) microvessel density determinations by CD34 staining of femur sections from vehicle- and _SB431542_-treated Gata1low mice. Original magnification ×20. Quantification with the Methamorph program of the Gomori-Silver and CD34 staining are presented as mean (±SD) of results obtained with 3 mice per experimental point in D and F. Results are compared with those observed in untreated Gata1low and wild-type littermates (pink and gray horizontal bars). Values statistically different (P < .05) between untreated wild-type and Gata1low mice and vehicle- and _SB431542_-treated Gata1low mice are indicated by & and *, respectively. (G) Hematoxylin-eosin staining of femur/tibias from untreated wild-type and Gata1low mice or from Gata1low mice treated with either SB431542 or vehicle, as indicated. Representative areas of medulla entrapped within the bone are presented at larger magnification on the right. Blue arrowheads indicate bone trabeculae protruding within the medulla. Red arrowheads indicate MKs embedded in areas of medulla surrounded by the bones. Magnification ×4 and ×20, as indicated.
Figure 5
Inhibition of TGF-β1 signaling normalizes the number and expression profile of progenitor cells, erythroid cells, and MKs in BM of Gata1low mice. (A) Frequency by flow cytometry for CD34/CD117 expression, (B), total numbers, and (C) expression profiling of Common erythroid/MK and common erythroid/MK and common myeloid/granulocyte/monocyte progenitors from BM of vehicle- and _SB431542_-treated Gata1low mice. Results are compared with those observed with untreated Gata1low and wild-type littermates (pink and gray horizontal bars). B (right) presents the total number of progenitor cells calculated on the basis of CFC evaluations. (D) Frequency by flow cytometry for Ter119/CD71 expression, (E) total numbers, and (F) expression profiling of erythroid cells from BM of vehicle- and _SB431542_-treated Gata1low mice. (G) Frequency by flow cytometry for CD61/CD41 expression, (H) total cell number, (I) representative morphology by EM of MKs from BM of vehicle- and _SB431542_-treated Gata1low mice, and (J) expression profiling. I, Magnification ×4400; Neu indicates a neutrophil. Total cell numbers were calculated by multiplying the mean frequencies presented in Table 6 per the total number of BM cells in the 3 animals analyzed in this experiment. Quantitative results are presented as mean (±SD) of at least 3 independent determinations with 3 mice per experimental point and are compared with those observed with the corresponding populations purified from untreated Gata1low and wild-type animals (pink and gray horizontal bars). Values statistically different (P < .01) between untreated Gata1low and wild-type animals and between vehicle- and _SB431542_-treated Gata1low mice are indicated by & and *, respectively.
Figure 6
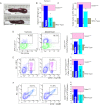
Inhibition of TGF-β1 signaling reduces splenomegaly in Gata1low mice. (A) Morphological appearance (original magnification ×1.5), (B) weight, and (C) total cell number of a representative spleen from vehicle- and _SB431542_-treated Gata1low mice, as indicated. (D) Frequency by flow cytometry for CD117/CD34 expression and total number of progenitor cells, (E) frequency by flow cytometry for Ter119/CD71 expression and total number of erythroid cells, and (F) frequency by flow cytometry for CD61/CD41 expression and total number of MKs in the spleen from vehicle- and _SB431542_-treated Gata1low mice are also presented. Results are compared with those observed in untreated Gata1low and wild-type animals (pink and gray horizontal bars). Total numbers of progenitor cells, erythroid cells, and MKs are calculated by multiplying the frequency of the different populations obtained by FACS (Table 6) per the total number of cells in the organs of the animals analyzed in these experiments and are presented as mean (±SD) of 5-6 independent determinations per experimental point. Values statistically different (P < .05) between untreated wild-type and Gata1low mice and vehicle- and _SB431542_-treated Gata1low mice are indicated by & and *, respectively.
Figure 7
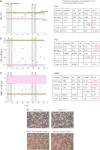
Inhibition of TGF-β1 signaling increases Ptl numbers and reduces WBC counts and frequency of poikilocytes but does not affect Hct levels in blood of Gata1low mice. Hct (A), Ptl numbers (B), and WBC counts (C) of Gata1low mice during treatment with SB431542 (red, 12 mice) or vehicle (black, 8 mice), as indicated. The vertical lines indicate the time of the treatment (see also supplemental Figure 1). The results are compared with those of untreated age- and sex-matched wild-type (gray box) and Gata1low (pink box) controls (10 mice each). Results are presented as mean (±SD) of independent measurements and analyzed with the mixed effects regression models using Restricted Maximum Likelihood Method, as summarized in the corresponding tables, on the right. (D) May-Grunwald staining of blood smears from representative untreated wild-type and Gata1low mice and Gata1low mice from vehicle- or _SB431542_-treated Gata1low mice. Representative poikilocytes are indicated by arrows. Original magnification ×40.
Similar articles
- Activation of non-canonical TGF-β1 signaling indicates an autoimmune mechanism for bone marrow fibrosis in primary myelofibrosis.
Ciaffoni F, Cassella E, Varricchio L, Massa M, Barosi G, Migliaccio AR. Ciaffoni F, et al. Blood Cells Mol Dis. 2015 Mar;54(3):234-41. doi: 10.1016/j.bcmd.2014.12.005. Epub 2015 Jan 15. Blood Cells Mol Dis. 2015. PMID: 25703685 Free PMC article. - P-Selectin Sustains Extramedullary Hematopoiesis in the Gata1 low Model of Myelofibrosis.
Spangrude GJ, Lewandowski D, Martelli F, Marra M, Zingariello M, Sancillo L, Rana RA, Migliaccio AR. Spangrude GJ, et al. Stem Cells. 2016 Jan;34(1):67-82. doi: 10.1002/stem.2229. Epub 2015 Oct 23. Stem Cells. 2016. PMID: 26439305 - A pathobiologic pathway linking thrombopoietin, GATA-1, and TGF-beta1 in the development of myelofibrosis.
Vannucchi AM, Bianchi L, Paoletti F, Pancrazzi A, Torre E, Nishikawa M, Zingariello M, Di Baldassarre A, Rana RA, Lorenzini R, Alfani E, Migliaccio G, Migliaccio AR. Vannucchi AM, et al. Blood. 2005 May 1;105(9):3493-501. doi: 10.1182/blood-2004-04-1320. Epub 2005 Jan 21. Blood. 2005. PMID: 15665119 - Novel targets to cure primary myelofibrosis from studies on Gata1low mice.
Zingariello M, Martelli F, Verachi P, Bardelli C, Gobbo F, Mazzarini M, Migliaccio AR. Zingariello M, et al. IUBMB Life. 2020 Jan;72(1):131-141. doi: 10.1002/iub.2198. Epub 2019 Nov 21. IUBMB Life. 2020. PMID: 31749302 Free PMC article. Review. - Understanding Splenomegaly in Myelofibrosis: Association with Molecular Pathogenesis.
Song MK, Park BB, Uhm JE. Song MK, et al. Int J Mol Sci. 2018 Mar 18;19(3):898. doi: 10.3390/ijms19030898. Int J Mol Sci. 2018. PMID: 29562644 Free PMC article. Review.
Cited by
- A comparative study on the effects of biodegradable high-purity magnesium screw and polymer screw for fixation in epiphyseal trabecular bone.
Chang L, Luo Y, Li W, Liu F, Guo J, Dai B, Tong W, Qin L, Wang J, Xu J. Chang L, et al. Regen Biomater. 2024 Sep 3;11:rbae095. doi: 10.1093/rb/rbae095. eCollection 2024. Regen Biomater. 2024. PMID: 39346687 Free PMC article. - The Role of Mutated Calreticulin in the Pathogenesis of _BCR-ABL1_-Negative Myeloproliferative Neoplasms.
Vadeikienė R, Jakštys B, Laukaitienė D, Šatkauskas S, Juozaitytė E, Ugenskienė R. Vadeikienė R, et al. Int J Mol Sci. 2024 Sep 12;25(18):9873. doi: 10.3390/ijms25189873. Int J Mol Sci. 2024. PMID: 39337361 Free PMC article. - The Variation in the Traits Ameliorated by Inhibitors of JAK1/2, TGF-β, P-Selectin, and CXCR1/CXCR2 in the _Gata1_low Model Suggests That Myelofibrosis Should Be Treated by These Drugs in Combination.
Gobbo F, Martelli F, Di Virgilio A, Demaria E, Sarli G, Migliaccio AR. Gobbo F, et al. Int J Mol Sci. 2024 Jul 13;25(14):7703. doi: 10.3390/ijms25147703. Int J Mol Sci. 2024. PMID: 39062946 Free PMC article. - Proteomic screening identifies PF4/Cxcl4 as a critical driver of myelofibrosis.
Capitanio D, Calledda FR, Abbonante V, Cattaneo D, Moriggi M, Niccolò B, Bucelli C, Tosi D, Gianelli U, Vannucchi AM, Iurlo A, Gelfi C, Balduini A, Malara A. Capitanio D, et al. Leukemia. 2024 Sep;38(9):1971-1984. doi: 10.1038/s41375-024-02354-z. Epub 2024 Jul 18. Leukemia. 2024. PMID: 39025985 - Identification of the Hub Genes Linked to Lead (IV)-Induced Spleen Toxicity Using the Rat Model.
Yang B, Wang Z, Hu Z, Wang S, Xu J, Li X. Yang B, et al. Biol Trace Elem Res. 2024 Oct;202(10):4618-4639. doi: 10.1007/s12011-023-04036-w. Epub 2023 Dec 28. Biol Trace Elem Res. 2024. PMID: 38153671
References
- Assoian RK, Komoriya A, Meyers CA, Miller DM, Sporn MB. Transforming growth factor-beta in human platelets. Identification of a major storage site, purification, and characterization. J Biol Chem. 1983;258(11):7155–7160. - PubMed
- Van Obberghen-Schilling E, Roche NS, Flanders KC, Sporn MB, Roberts AB. Transforming growth factor beta 1 positively regulates its own expression in normal and transformed cells. J Biol Chem. 1988;263(16):7741–7746. - PubMed
Publication types
MeSH terms
Substances
LinkOut - more resources
Full Text Sources
Other Literature Sources
Molecular Biology Databases
Research Materials
Miscellaneous
