A genetic screen identifies interferon-α effector genes required to suppress hepatitis C virus replication - PubMed (original) (raw)
. 2013 Jun;144(7):1438-49, 1449.e1-9.
doi: 10.1053/j.gastro.2013.02.026. Epub 2013 Feb 24.
Cynthia Brisac, Sinu P John, Yi-Wen Huang, Christopher R Chin, Tiao Xie, Hong Zhao, Nikolaus Jilg, Leiliang Zhang, Stephane Chevaliez, Daniel Wambua, Wenyu Lin, Lee Peng, Raymond T Chung, Abraham L Brass
Affiliations
- PMID: 23462180
- PMCID: PMC3665646
- DOI: 10.1053/j.gastro.2013.02.026
A genetic screen identifies interferon-α effector genes required to suppress hepatitis C virus replication
Dahlene N Fusco et al. Gastroenterology. 2013 Jun.
Abstract
Background & aims: Hepatitis C virus (HCV) infection is a leading cause of end-stage liver disease. Interferon-α (IFNα) is an important component of anti-HCV therapy; it up-regulates transcription of IFN-stimulated genes, many of which have been investigated for their antiviral effects. However, all of the genes required for the antiviral function of IFNα (IFN effector genes [IEGs]) are not known. IEGs include not only IFN-stimulated genes, but other nontranscriptionally induced genes that are required for the antiviral effect of IFNα. In contrast to candidate approaches based on analyses of messenger RNA (mRNA) expression, identification of IEGs requires a broad functional approach.
Methods: We performed an unbiased genome-wide small interfering RNA screen to identify IEGs that inhibit HCV. Huh7.5.1 hepatoma cells were transfected with small interfering RNAs incubated with IFNα and then infected with JFH1 HCV. Cells were stained using HCV core antibody, imaged, and analyzed to determine the percent infection. Candidate IEGs detected in the screen were validated and analyzed further.
Results: The screen identified 120 previously unreported IEGs. From these, we more fully evaluated the following: asparagine-linked glycosylation 10 homolog (yeast, α-1,2-glucosyltransferase); butyrylcholinesterase; dipeptidyl-peptidase 4 (CD26, adenosine deaminase complexing protein 2); glucokinase (hexokinase 4) regulator; guanylate cyclase 1, soluble, β 3; MYST histone acetyltransferase 1; protein phosphatase 3 (formerly 2B), catalytic subunit, β isoform; peroxisomal proliferator-activated receptor-γ-DBD-interacting protein 1; and solute carrier family 27 (fatty acid transporter), member 2; and demonstrated that they enabled IFNα-mediated suppression of HCV at multiple steps of its life cycle. Expression of these genes had more potent effects against flaviviridae because a subset was required for IFNα to suppress dengue virus but not influenza A virus. In addition, many of the host genes detected in this screen (92%) were not transcriptionally stimulated by IFNα; these genes represent a heretofore unknown class of non-IFN-stimulated gene IEGs.
Conclusions: We performed a whole-genome loss-of-function screen to identify genes that mediate the effects of IFNα against human pathogenic viruses. We found that IFNα restricts HCV via actions of general and specific IEGs.
Copyright © 2013 AGA Institute. Published by Elsevier Inc. All rights reserved.
Figures
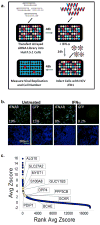
Figure 1. A Functional Genomic Screen Identifies 120 HCV-IEGs
(A) Huh7.5.1 cells were transfected with siRNA followed 48h later by IFN-α treatment (100IU/ml) then 24h later by infection with JFH1 HCV. 48h post infection cells were fixed, permeabilized, and stained with HCV core Ab and Hoechst 33342 DNA stain, then imaged and analyzed for percent HCV infection. (B) Huh7.5.1 cells were transfected with positive (IFNAR1) and negative (green fluorescent protein (GFP)) control siRNA, treated with IFN-α or buffer alone, then infected with JFH1 HCV. Cells were then stained for HCV core (green) and host cell DNA (blue). Both controls exhibit similar levels of HCV infection in the absence of IFN-α treatment (left). In the presence of IFN-α (right), HCV infection is suppressed in negative control cells, and rescued by IFNAR knockdown. (C) HCV-IEG rank plot. The average Z score for all genes screened is displayed; genes are ranked according to Z score. Select HCV-IEGs are highlighted.
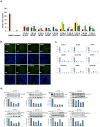
Figure 2. HCV-IEG Validations: Comparison of Knockdown to Phenotype
(A) Rescue phenotype analyses were repeated to confirm rescue of HCV infection from IFN-α (100IU/ml) by IEG knockdown. Y axis values represent mean fold rescue of HCV above levels in cells transfected with non-targeting siRNA, X axis values indicate target gene and individual siRNA duplex. Values represent mean +/− SEM; n≥3 throughout; * p < 0.05. Results were analyzed by paired t tests. (B) Huh7.5.1 cells were transfected with indicated siRNA, treated with IFN-α 100 IU/ml, then infected with JFH1 HCV, followed by staining for HCV core (green) and host cell DNA (blue). Sample images for top siRNAs scoring for HCV rescue from IFN-α (100IU/ml) are presented alongside positive (IFNAR) and negative (GFP, NT2) controls. siRNA and percent infection are indicated. (C) mRNA knockdown efficiency for each of 4 individual siRNAs per gene is calculated by comparison to target gene expression levels in cells transfected with non-targeting siRNA; values were normalized using GAPDH. siRNA was transfected into Huh7.5.1 cells, followed 48h later by IFN-α (100IU/ml) treatment for 24h, then qRT-PCR for target gene expression. Y axes indicate relative mRNA expression; X axes indicate transfected siRNA. Values represent the mean +/− SEM; n≥3 throughout. (D) Huh7.5.1 cells were transfected with target gene siRNA for 48h then treated with IFN-α (100IU/ml) for 24h followed by protein extraction for western blot.
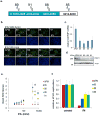
Figure 3. PDIP1 Depletion Rescues HCV from IFN-α
(A) Schematic of PDIP1 and target sites of PDIP1 shRNAs. shRNAs 89, 91 and 88 target coding sequence, while 85 targets 3′UTR. Nucleotide (nt) binding sites of each shRNA to PDIP1 (NCBI NM 001037335.2) are indicated. (B) Stable PDIP1 knockdown cell lines were made by transducing Huh7.5.1 cells with lentiviral particles carrying indicated shRNAs. APM control vector contains shRNA against luciferase. Cells were treated with indicated concentration of IFN-α for 24h, followed by infection with JFH1. 48h post-infection, cells were fixed, stained for HCV core and DNA, then analyzed as above. Cells were scored for percent HCV infection using HCV core Ab (green) and DNA stain (blue). Cell line, percent infection are indicated. Top and bottom cells were treated with 1600 and 100 IU/ml IFN-α, respectively. (C) Stable cell lines were assessed for PDIP1 mRNA knockdown through qRT-PCR and normalized to control APM cell line. (D) Western blot for cells in (C), kDa = kilodalton. (E) Correlate data for images in (B). Phenotypic analysis of PDIP1 knockdown cells (88, 89, 91 and 85) compared to vector cells (APM). (F) PDIP1 knockdown cells were treated with IFN-α 1600 IU/ml for 24h, followed by JFH1 infection for 48h, then intracellular RNA isolation for JFH1 qRT-PCR. Values for (C), (E) and (F) represent mean ±SEM for 3 independent experiments.
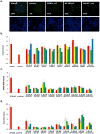
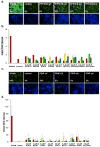
Figure 4. HCV-IEGs are Required for IFN-α-mediated Suppression of Viral Entry and Viral RNA Replication
For each candidate HCV-IEG, 4 distinct siRNAs were tested. For Huh7.5.1 cell studies, cells were transfected with indicated siRNAs then treated with IFN-α followed 24h later by indicated intervention. Y axes indicates mean fold rescue above control. X axes indicates siRNA. (A) Cells were infected with pseudoparticles (pp) for 48h. Top row images show GFP positive HCVpp, with corresponding cell nuclei (DNA stained) below. (B) HCV-IEG knockdown was assessed for rescue of HCV entry from IFN-α suppression. (C) HCV-IEG knockdown was assessed for rescue of HCV replication from IFN-α in OR6 replicon cells. Replicon cells were transfected with indicated siRNAs, then 48h later cells were treated with 6IU/ml of IFN-α for 24h followed by evaluation of Renilla Luciferase or ATP (cell titer glo) levels. OR6 Renilla Luciferase levels for each transfection were normalized to ATP levels. Normalized OR6 signals for each IEG knockdown were compared to corresponding control to calculate fold rescue. (D) HCV-IEG knockdown rescues HCV RNA production from IFN-α. Cells were infected with JFH1 for 48h, followed by isolation of intracellular RNA and performance of qRT-PCR to quantify JFH1 RNA. All values were normalized to GAPDH. For all lifecycle assays, values represent mean +/− SEM; n≥3 throughout; * p < 0.05. Results were analyzed by paired t tests.
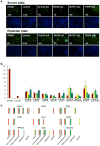
Figure 5. IFN-α’s Block of Infectious Virion Production Requires HCV-IEGs
(A) HCV-IEG knockdown was assessed for rescue of HCV infectious virion production from IFN-α. Cells were infected with JFH1 HCV, then after 48h viral supernatant was transferred in a well-by-well manner to destination plates. Destination plates were incubated for 48h, then scored for percent infection as in original screen. Top row shows source plate and the bottom row shows destination plate. (B) HCV-IEG knockdown was assessed for rescue of HCV infectious virion production from IFN-α suppression. Y axis indicates mean fold rescue above control. X axis indicates siRNA. (C) Summary of lifecycle assay results per siRNA duplex are presented. Each colored bar indicates that a given siRNA scored positive (p<0.05 compared to control) for indicated lifecycle assay (X axis). Red, yellow, green, blue represent siRNA duplexes 1,2,3,4 respectively. Target genes and lifecycle stage are indicated.
Figure 6. The Majority of HCV-IEGs are not ISGs
Top candidate HCV-IEGs were evaluated for increase in mRNA level upon IFN-α stimulation. (A) Huh7.5.1 cells were stimulated with IFN-α (100 IU/ml) for 4h or 24h, as indicated on X axis, followed by RNA isolation and qRT-PCR for target gene quantitation. Y axes indicate relative mRNA expression normalized using GAPDH. (B) Experiment was performed as in (A), but IFN-λ (542 IU/ml) replaced IFNα. Values for (A) and (B) represent mean ±SEM for 3 separate experiments.
Figure 7. HCV-IEGs are Needed for IFN-α’s Restriction of DENV but Not IAV
(A) HeLa MAGI cells were transfected with indicated siRNA, followed by IFN-α treatment then influenza A virus (IAV) infection followed by staining for anti-HA 29 (green) and DNA (blue), imaging, and scoring for percent infection. siRNA and percent infection are indicated. (B) Corresponding data for (A). X axis indicates mean fold rescue above non-targeting siRNA and Y axis indicates siRNA transfected, where 4 distinct siRNAs were used for each IEG. (C) HeLa MAGI cells were transfected with indicated siRNA, followed by IFN-α treatment then dengue virus (DENV) infection followed by staining for DENV core (green) and DNA (blue), imaging, and scoring for percent infection. siRNA and percent infection are indicated. (D) Corresponding data for (C). X axis indicates mean fold rescue above non-targeting siRNA and Y axis indicates siRNA transfected, where 4 distinct siRNAs were used for each IEG. Values for (B) and (D) represent mean ± SEM for 3 separate experiments.
Similar articles
- The spliceosome factor SART1 exerts its anti-HCV action through mRNA splicing.
Lin W, Zhu C, Hong J, Zhao L, Jilg N, Fusco DN, Schaefer EA, Brisac C, Liu X, Peng LF, Xu Q, Chung RT. Lin W, et al. J Hepatol. 2015 May;62(5):1024-32. doi: 10.1016/j.jhep.2014.11.038. Epub 2014 Dec 3. J Hepatol. 2015. PMID: 25481564 Free PMC article. - Interferon-alpha-induced TRAIL on natural killer cells is associated with control of hepatitis C virus infection.
Stegmann KA, Björkström NK, Veber H, Ciesek S, Riese P, Wiegand J, Hadem J, Suneetha PV, Jaroszewicz J, Wang C, Schlaphoff V, Fytili P, Cornberg M, Manns MP, Geffers R, Pietschmann T, Guzmán CA, Ljunggren HG, Wedemeyer H. Stegmann KA, et al. Gastroenterology. 2010 May;138(5):1885-97. doi: 10.1053/j.gastro.2010.01.051. Epub 2010 Feb 2. Gastroenterology. 2010. PMID: 20334827 - Novel type I interferon IL-28A suppresses hepatitis C viral RNA replication.
Zhu H, Butera M, Nelson DR, Liu C. Zhu H, et al. Virol J. 2005 Sep 7;2:80. doi: 10.1186/1743-422X-2-80. Virol J. 2005. PMID: 16146571 Free PMC article. - New drugs for hepatitis C virus (HCV).
Clarke BE. Clarke BE. Baillieres Best Pract Res Clin Gastroenterol. 2000 Apr;14(2):293-305. doi: 10.1053/bega.1999.0077. Baillieres Best Pract Res Clin Gastroenterol. 2000. PMID: 10890323 Review. - Understanding the molecular mechanism(s) of hepatitis C virus (HCV) induced interferon resistance.
Qashqari H, Al-Mars A, Chaudhary A, Abuzenadah A, Damanhouri G, Alqahtani M, Mahmoud M, El Sayed Zaki M, Fatima K, Qadri I. Qashqari H, et al. Infect Genet Evol. 2013 Oct;19:113-9. doi: 10.1016/j.meegid.2013.06.025. Epub 2013 Jul 5. Infect Genet Evol. 2013. PMID: 23831932 Review.
Cited by
- A zebrafish model of Ifih1-driven Aicardi-Goutières syndrome reproduces the interferon signature and the exacerbated inflammation of patients.
Bernal-Bermúdez B, Martínez-López A, Martínez-Morcillo FJ, Tyrkalska SD, Martínez-Menchón T, Mesa-Del-Castillo P, Cayuela ML, Mulero V, García-Moreno D. Bernal-Bermúdez B, et al. Front Immunol. 2023 Nov 24;14:1294766. doi: 10.3389/fimmu.2023.1294766. eCollection 2023. Front Immunol. 2023. PMID: 38077314 Free PMC article. - Suppression of Innate Immunity by the Hepatitis C Virus (HCV): Revisiting the Specificity of Host-Virus Interactive Pathways.
Barik S. Barik S. Int J Mol Sci. 2023 Nov 8;24(22):16100. doi: 10.3390/ijms242216100. Int J Mol Sci. 2023. PMID: 38003289 Free PMC article. Review. - HELZ2: a new, interferon-regulated, human 3'-5' exoribonuclease of the RNB family is expressed from a non-canonical initiation codon.
Huntzinger E, Sinteff J, Morlet B, Séraphin B. Huntzinger E, et al. Nucleic Acids Res. 2023 Sep 22;51(17):9279-9293. doi: 10.1093/nar/gkad673. Nucleic Acids Res. 2023. PMID: 37602378 Free PMC article. - Discovering antiviral restriction factors and pathways using genetic screens.
Jones CE, Tan WS, Grey F, Hughes DJ. Jones CE, et al. J Gen Virol. 2021 May;102(5):001603. doi: 10.1099/jgv.0.001603. J Gen Virol. 2021. PMID: 34020727 Free PMC article. Review. - A CRISPR screen identifies IFI6 as an ER-resident interferon effector that blocks flavivirus replication.
Richardson RB, Ohlson MB, Eitson JL, Kumar A, McDougal MB, Boys IN, Mar KB, De La Cruz-Rivera PC, Douglas C, Konopka G, Xing C, Schoggins JW. Richardson RB, et al. Nat Microbiol. 2018 Nov;3(11):1214-1223. doi: 10.1038/s41564-018-0244-1. Epub 2018 Sep 17. Nat Microbiol. 2018. PMID: 30224801 Free PMC article.
References
- De Clercq E. Ten paths to the discovery of antivirally active nucleoside and nucleotide analogues. Nucleosides Nucleotides Nucleic Acids. 2012;31:339–52. - PubMed
- Isaacs A, Lindenmann J. Virus interference. I. The interferon. Proc R Soc Lond B Biol Sci. 1957;147:258–67. - PubMed
Publication types
MeSH terms
Substances
Grants and funding
- P30 DK043351/DK/NIDDK NIH HHS/United States
- R01 AI091786/AI/NIAID NIH HHS/United States
- U19 AI082630/AI/NIAID NIH HHS/United States
- 1R01AI091786/AI/NIAID NIH HHS/United States
LinkOut - more resources
Full Text Sources
Other Literature Sources
Medical
Research Materials
Miscellaneous
