Stabilization of actin bundles by a dynamin 1/cortactin ring complex is necessary for growth cone filopodia - PubMed (original) (raw)
. 2013 Mar 6;33(10):4514-26.
doi: 10.1523/JNEUROSCI.2762-12.2013.
Tadashi Abe, Ayano Satoh, Nana Okazaki, Shota Tago, Kinue Kobayashi, Yumi Yoshida, Yoshiya Oda, Masami Watanabe, Kazuhito Tomizawa, Hideki Matsui, Kohji Takei
Affiliations
- PMID: 23467367
- PMCID: PMC6704951
- DOI: 10.1523/JNEUROSCI.2762-12.2013
Stabilization of actin bundles by a dynamin 1/cortactin ring complex is necessary for growth cone filopodia
Hiroshi Yamada et al. J Neurosci. 2013.
Abstract
Dynamin GTPase, a key molecule in endocytosis, mechanically severs the invaginated membrane upon GTP hydrolysis. Dynamin functions also in regulating actin cytoskeleton, but the mechanisms are yet to be defined. Here we show that dynamin 1, a neuronal isoform of dynamin, and cortactin form ring complexes, which twine around F-actin bundles and stabilize them. By negative-staining EM, dynamin 1-cortactin complexes appeared as "open" or "closed" rings depending on guanine nucleotide conditions. By pyrene actin assembly assay, dynamin 1 stimulated actin assembly in mouse brain cytosol. In vitro incubation of F-actin with both dynamin 1 and cortactin led to the formation of long and thick actin bundles, on which dynamin 1 and cortactin were periodically colocalized in puncta. A depolymerization assay revealed that dynamin 1 and cortactin increased the stability of actin bundles, most prominently in the presence of GTP. In rat cortical neurons and human neuroblastoma cell line, SH-SY5Y, both dynamin 1 and cortactin localized on actin filaments and the bundles at growth cone filopodia as revealed by immunoelectron microscopy. In SH-SY5Y cell, acute inhibition of dynamin 1 by application of dynamin inhibitor led to growth cone collapse. Cortactin knockdown also reduced growth cone filopodia. Together, our results strongly suggest that dynamin 1 and cortactin ring complex mechanically stabilizes F-actin bundles in growth cone filopodia. Thus, the GTPase-dependent mechanochemical enzyme property of dynamin is commonly used both in endocytosis and regulation of F-actin bundles by a dynamin 1-cortactin complex.
Figures
Figure 1.
Inhibition of dynamin 1 reduces actin dynamics in brain cytosol. A, Anti-dynamin 1 antibodies strongly inhibit PS-induced actin assembly. Mouse brain cytosol was either treated with 120 μ
m
PS-containing liposomes (+PS-lipo.) (solid lines) or incubated alone (+Buffer) (dotted lines). The time 0 indicates the point of liposome addition. In same samples, the cytosol was preincubated for 10 min with 7.5 μg of anti-dynamin 1 antibodies (+Anti Dyn 1) or nonspecific rabbit IgG (+IgG). To inactivate anti-dynamin 1 antibodies, the antibodies were pretreated with 7.5 μg of corresponding antigenic peptides for 30 min at room temperature (+Peptide). Very few actin polymerization was observed in the presence of 10 μ
m
Cytocharasin D (+ Cyt. D). B, Actin assembly was reduced in dynamin 1-depleted cytosol. For the immunodepletion, rat brain cytosol was incubated with 10 μg of anti-dynamin 1 antibodies for 2 h at 4°C and then for an additional 1 h with protein G-Sepharose beads. The dynamin 1-antibody complexes bound to the protein G-Sepharose beads were removed by centrifugation. C, Inhibition of PS-induced actin assembly by dynasore. Brain cytosol was pretreated with 10 or 40 μ
m
dynasore for 10 min. For negative control for dynasore, 1% DMSO is used. Dotted lines represent samples in which PS-liposomes were omitted. D, Anti-dynamin 1 antibodies did not recognize dynamin 2 or dynamin 3. Mouse brain cytosol or mouse testis cytosol (5 μg), which is enriched with dynamin 3, was analyzed by Western blotting. For controls, 0.25 μg of recombinant human dynamin 1 or rat dynamin 2 were used. E, Inactivation of anti-dynamin 1 antibody by the antigenic peptides. Five micrograms of the antibody was incubated with 500 μg of the corresponding antigenic peptides for 2 h. Mouse brain cytosol (5 μg) was analyzed by Western blotting with either untreated anti-dynamin 1 antibody (left), or the inactivated antibody (right). F, Immunodepletion of dynamin 1 from rat brain cytosol. Rat brain cytosol was incubated with 10 μg of anti-dynamin 1 antibody for 2 h at 4°C, and then for an additional 1 h with protein G-Sepharose beads. The dynamin 1–antibody complexes bound to the protein G-Sepharose beads were removed by centrifugation. The resultant cytosol (10 μg) was examined by Western blotting.
Figure 2.
Dynamin 1 directly binds to cortactin in vitro and in vivo. A, Identification of proteins interacting with dynamin 1 during lipid-induced actin polymerization by mass spectrometry. Mouse brain cytosol (50 μg) was incubated at 37°C for 15 min in the presence of 0.1 m
m
GTPγS, 40 μg of liposomes consisting of 74% Folch fraction, 6% phosphatidylinositol (4,5)-bisphosphate and 20% cholesterol, and with or without an ATP generating system. The liposomes collected by sedimentation were separated by SDS-PAGE, and all proteins in the gel were treated with trypsin. The digested peptides were then analyzed by MALDI-MS. Nine potential proteins were identified. B, GST pull-down assay demonstrating that both GST-Cortactin and GST-Cortactin SH3 bound to dynamin 1. The binding was not detected with cortactin mutants lacking SH3 (GST-Cort 1–80, GST-Cort 284–450, GST-Cort ΔSH3). Brain extract (20 μg) was also loaded (Input) (left). Dynamin 1 PRD directly bound to Cort WT but not to its SH3 point mutant, W525K (right). C, SDS-PAGE of GST fusion proteins used in (B). Five micrograms of purified GST fused cortactin mutants indicated were analyzed. D, Immunoprecipitation demonstrating an in vivo interaction between dynamin 1 and cortactin. Differentiated NG108-15 cells were cotransfected with GFP-tagged dynamin 1 and either myc-tagged cortactin (Cort WT-myc, left) or cortactin ΔSH3 (Cort ΔSH3-myc, right). The protein complexes were immunoprecipitated using polyclonal anti-myc antibodies or preimmune IgG, and then visualized by Western blotting with monoclonal anti-GFP or anti-myc antibodies. Total cell lysates (5 μg) were also loaded (Input).
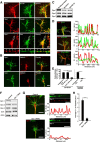
Figure 3.
Dynamin 1 colocalizes with cortactin in puncta aligned along filopodia of growth cones. A, Immunofluorescence demonstrating the presence of dynamin 1 (top) and cortactin (middle) in the growth cones of primary cultured cortical neuron. Colocalization of dynamin 1 and cortactin was visualized by double-immunofluorescence. Framed areas are enlarged below (bottom). Note that dynamin 1- and cortactin-positive puncta were present periodically along the filopodia (arrowheads). Scale bar: top, middle, and bottom panels, 5 μm; insets, 1.6 μm. B, Clathrin is not enriched in the growth cone filopodia. Double-immunofluorescence demonstrating that the localization of clathrin was distinct from that of dynamin 1 and cortactin in the growth cones of cortical neurons. Note that virtually no immunoreactivity for clathrin was observed in the filopodia. Scale bar, 5 μm. C, Expression of dynamin isoforms in newly born mouse P0 brain or, neuroblastoma cell lines analyzed by Western blotting. P0 mouse brain homogenate (10 μg), SH-SY5Y cells (20 μg), and NG108-15 cells (20 μg) were loaded per lane. D, Periodic colocalization of dynamin 1 and cortactin along growth cone filopodia of SH-SY5Y cells (top left). Localization of Cort WT-myc (middle left) or Cort ΔSH3-myc (bottom left) with dynamin 1 was examined in SH-SY5Y cells. Scale bar, 10 μm. Line scanning of fluorescence intensity for dynamin 1 (red) and cortactin (green) in the area indicated with a white line (right panels) is shown. E, Colocalization measurement of endogenous or exogenous cortactin and dynamin 1 in growth cone filopodia of SH-SY5Y cells or rat cortical neurons. The data shown are the mean ± SEM. In each sample, 60–100 filopodia of growth cones from three experiments were analyzed. **p < 0.01. F–H, Disappearance of periodic presence of dynamin 1 along growth cone filopodia in dynamin 1-depleted SH-SY5Y cells. Western blotting showing suppression of dynamin 1 by RNAi in SH-SY5Y cells (F). β-Actin was used as the control. Cell lysate (3 μg) was loaded in each lane (F). Periodic localization of dynamin 1 in growth cone filopodia (upper left in G) was impaired in dynamin 1-depleted SH-SY5Y cells (lower left in G). Line scanning of fluorescence intensity (F.I.) for dynamin 1 (red) and phalloidin (green) in the area indicated with a white line is shown in the right panels in G. Filopodia were determined by phalloidin staining. Scale bar: left panels, 10 μm; right panels, 3 μm. H, Average F.I. for dynamin 1 in growth cone filopodia was also decreased by dynamin 1 RNAi (n = 35 each, **p < 0.01).
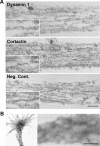
Figure 4.
Dynamin 1 and cortactin associate with actin filaments. A, Preembedding immunoelectron microscopy for dynamin 1 (top) and cortactin (middle) in SH-SY5Y cells. An anti-dynamin 1 antibody (PA1-660) or an anti-cortactin antibody was detected using 5 nm colloidal gold-conjugated anti-rabbit IgG, or 10 nm colloidal gold-conjugated anti-mouse IgG, respectively. The primary antibodies were omitted in the negative control (bottom). Scale bar: A, 300 nm; insets, 150 nm. B, Double staining for dynamin 1 and cortactin in growth cone filopodia of whole-mount SH-SY5Y cells. The primary antibodies and immunogold-conjugated secondary antibodies were used as in A. A filopodium indicated with a rectangle in the low-magnification EM (left), is enlarged on the right. Note that dynamin (5 nm gold) and cortactin (10 nm gold) closely localize on a actin bundle (right). Scale bar: left, 8 μm; right, 300 nm.
Figure 5.
Inhibition of dynamin 1 or knockdown of cortactin destabilizes growth cone filopodia. A, Sequential DIC images of growth cones of SH-SY5Y cells are shown. Dynasore (80 μ
m
) was applied to the samples 90 s after the beginning of imaging. Note the rapid filopodium retraction that occurs within 120 s of dynasore addition. Arrowheads indicate the positions of filopodia tip at time 0. Scale bar, 10 μm. B, Jasplakinolide prevented dynasore-induced filopodium retraction. SH-SY5Y cells were preincubated with or without 50 n
m
Jasplakinolide (+JASP) for 30 min, and then treated with 80 μ
m
dynasore (+Dynasore) for 5 min. As a negative control, cells were treated with 1% DMSO (+DMSO). For wash out experiment, dynasore-treated cells were incubated in medium without dynasore for 60 min (Washout). Growth cones were visualized by staining with Alexa Fluor 488-phalloidin. Scale bar, 10 μm. C, Morphometric analysis of the length of growth cone filopodium in B. All results are represented as the mean ± SEM. In each sample, 90–120 growth cones filopodia were analyzed from three experiments. (**p < 0.01). D, Western blotting showing suppression of cortactin expression by RNAi in SH-SY5Y cells. β-Actin was used as the control. Cell lysate (3 μg) was loaded in each lane. E, Growth cones of SH-SY5Y cells visualized by Alexa Fluor 488-phalloidin staining. In cortactin-depleted cells, the mean length of filopodia is shorter and the area of growth cones is smaller than that of the control cells (left panels). Cortactin depleted SH-SY5Y cells were transfected with cDNA of rat cortactin (middle panels) or Cort W525K (right panels) cloned into pIRES2-AcGFP1 expression vector. Transfected cells were determined by GFP expression. Scale bar, 10 μm. F, The mean length of growth cone filopodia in SH-SY5Y cells in (E). All results represent the mean ± SEM. In each sample, 82–100 growth cones filopodia were analyzed from three experiments. **p < 0.01.
Figure 6.
Direct interaction between dynamin 1 and cortactin is essential for actin filament bundling. A, F-actin bundle formation by dynamin 1 and either WT or mutant cortactin in the presence of GTP detected by a low-speed sedimentation assay. Dynamin 1 and cortactin were used at 5 μ
m
. Note that significant amount of F-actin bundles were formed in the presence of both dynamin 1 and Cort WT. B, Quantitation of F-actin bundle formation with various concentrations of dynamin 1 and cortactin. The F-actin bundles recovered in the low-speed pellet were measured. All results represent the mean ± SEM (n = 3). **p < 0.01. C, Long F-actin bundles are formed in the presence of both dynamin 1 and cortactin. Preformed actin filaments were incubated with or without dynamin 1 and cortactin in the presence of GTP. F-actin was visualized by adding Alexa Fluor 488-phalloidin. Actin filaments alone appear as uniformly dispersed thin threads (F-actin). Dynamin 1 alone induced no visible change in the filament (+Dyn 1). Cortactin induced clustering of F-actin (+Cort). Long and thick F-actin bundles formed in the presence of both dynamin 1 and cortactin (+Dyn 1+Cort). Scale bar, 30 μm.
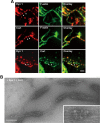
Figure 7.
Dynamin 1 colocalizes with cortactin in puncta along F-actin bundles. A, Immunofluorescence demonstrating periodical presence of dynamin 1 and cortactin along F-actin bundles (top and middle). Colocalization of dynamin 1 and cortactin on F-actin bundles was revealed by double-immunofluorescence (bottom). Arrowheads indicate the periodic localization. Scale bar, 2 μm. B, Electron micrographs of negatively stained F-actin bundles formed by dynamin 1 and cortactin. The incubations were performed as in A. Note the periodical presence of protein clusters along the F-actin bundles. Note that dynamin 1-cortactin complexes twine around several actin filaments (inset). Scale bar: B, 250 nm; inset, 120 nm.
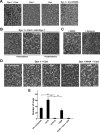
Figure 8.
Dynamin 1 and cortactin copolymerize into ring-shaped complex, which undergoes open-and-close conformational change upon GTP hydrolysis. A, Electron micrographs of negatively stained dynamin 1–cortactin complexes formed in the presence of GTP (left). The complexes were not formed with dynamin 1 alone, cortactin alone or dynamin 1 and Cort W525K (right three panels). B, Preincubation of dynamin 1 with 7.5 μg of anti-dynamin 1 antibody (PA1-660) at room temperature for 30 min prevented the ring-shaped complex formation (left). This inhibitory effect was reversed by the inactivation of the antibody with corresponding 7.5 μg of antigenic peptides (middle). Addition of the antibodies to preformed dynamin 1–cortactin ring complexes (post-treatment) also resulted in complex disruption (right). C, Dynasore (80 μ
m
) inhibited the formation of dynamin 1–cortactin ring-shaped complexes (right). As a control, 1% DMSO was used (left). D, Dynamin 1–cortactin complexes formed under indicated guanine nucleotides conditions. Ring-shaped complex were formed without nucleotide, or with GTP or GDP. The rings are widely open or almost linear in the presence of GTPγS. Dynamin 1 K44A plus cortactin in the presence of GTP also failed to form rings. Scale bar: A–D, 50 nm. E, Morphometric analysis of the ring-shaped complex formation in D. Closed rings and open rings that have more than three quarters were considered as rings as described in Materials and Methods. (**p < 0.01).
Figure 9.
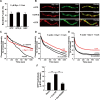
Dynamin 1–cortactin ring complexes use GTP hydrolysis to stabilize actin filaments. A, Actin bundle formation induced by dynamin 1 and cortactin at different guanine nucleotide conditions as quantified by a low-speed sedimentation assay. Dynamin 1 and cortactin were used at 5 μ
m
. All results represent the mean ± SEM (n = 3). B, Immunofluorescence showing differential distributions of dynamin 1 and cortactin along F-actin bundles formed under distinct guanine nucleotide conditions. The periodic localization of dynamin 1 and cortactin is most prominent in the presence of GTP (top), but it is obscure in the presence of GTPγS (middle) or when dynamin 1 is replaced with dynamin 1 K44A in the presence of GTP (bottom). Scale bar, 2 μm. C, Kinetics of F-actin disassembly induced by tenfold dilution. Note the prominent suppression of disassembly in the presence of dynamin 1 and cortactin with GTP (red line) as well as in the presence of 5 μ
m
α-actinin. D, E, Kinetics of F-actin disassembly with dynamin 1 and cortactin and distinct guanine nucleotide conditions. Actin bundles were disassembled by dilution (D) or by Mycalolide B (E). In both sets of experiments, the rate of disassembly was slowest in the presence of GTP (red lines). F, Dynamin 1 GTPase activity was stimulated by Cort WT but not by Cort W525K. All results represent the mean ± SEM (n = 3). **p < 0.01.
Figure 10.
Model of mechanical bundling of actin filaments by dynamin 1–cortactin ring complex. Dynamin 1–cortactin polymerizes into ring-shaped complex, which undergoes open and closed conformational change. The rings are open at GTP bound state, and closed at GDP bound state. Actin filaments are cross-linked by the complex, and upon GTP hydrolysis, the filaments would be tightened by a closing motion of the ring complex. Increased dynamin GTPase activity by cortactin would facilitate this process.
Similar articles
- Actin bundling by dynamin 2 and cortactin is implicated in cell migration by stabilizing filopodia in human non-small cell lung carcinoma cells.
Yamada H, Takeda T, Michiue H, Abe T, Takei K. Yamada H, et al. Int J Oncol. 2016 Sep;49(3):877-86. doi: 10.3892/ijo.2016.3592. Epub 2016 Jun 30. Int J Oncol. 2016. PMID: 27572123 Free PMC article. - Phosphorylation of cortactin by cyclin-dependent kinase 5 modulates actin bundling by the dynamin 1-cortactin ring-like complex and formation of filopodia and lamellipodia in NG108-15 glioma-derived cells.
Abe T, La TM, Miyagaki Y, Oya E, Wei FY, Sumida K, Fujise K, Takeda T, Tomizawa K, Takei K, Yamada H. Abe T, et al. Int J Oncol. 2019 Feb;54(2):550-558. doi: 10.3892/ijo.2018.4663. Epub 2018 Dec 11. Int J Oncol. 2019. PMID: 30570111 Free PMC article. - Possible role of cortactin phosphorylation by protein kinase Cα in actin-bundle formation at growth cone.
Yamada H, Kikuchi T, Masumoto T, Wei FY, Abe T, Takeda T, Nishiki T, Tomizawa K, Watanabe M, Matsui H, Takei K. Yamada H, et al. Biol Cell. 2015 Sep;107(9):319-30. doi: 10.1111/boc.201500032. Epub 2015 Jun 23. Biol Cell. 2015. PMID: 26033110 - Cortactin branches out: roles in regulating protrusive actin dynamics.
Ammer AG, Weed SA. Ammer AG, et al. Cell Motil Cytoskeleton. 2008 Sep;65(9):687-707. doi: 10.1002/cm.20296. Cell Motil Cytoskeleton. 2008. PMID: 18615630 Free PMC article. Review. - Actin dynamics in growth cone motility and navigation.
Gomez TM, Letourneau PC. Gomez TM, et al. J Neurochem. 2014 Apr;129(2):221-34. doi: 10.1111/jnc.12506. Epub 2013 Nov 17. J Neurochem. 2014. PMID: 24164353 Free PMC article. Review.
Cited by
- Regulation of the Actin Cytoskeleton in Podocytes.
Blaine J, Dylewski J. Blaine J, et al. Cells. 2020 Jul 16;9(7):1700. doi: 10.3390/cells9071700. Cells. 2020. PMID: 32708597 Free PMC article. Review. - Src kinases regulate de novo actin polymerization during exocytosis in neuroendocrine chromaffin cells.
Olivares MJ, González-Jamett AM, Guerra MJ, Baez-Matus X, Haro-Acuña V, Martínez-Quiles N, Cárdenas AM. Olivares MJ, et al. PLoS One. 2014 Jun 5;9(6):e99001. doi: 10.1371/journal.pone.0099001. eCollection 2014. PLoS One. 2014. PMID: 24901433 Free PMC article. - Cytoskeleton-Associated Risk Modifiers Involved in Early and Rapid Progression of Sporadic Creutzfeldt-Jakob Disease.
Zafar S, Younas N, Sheikh N, Tahir W, Shafiq M, Schmitz M, Ferrer I, Andréoletti O, Zerr I. Zafar S, et al. Mol Neurobiol. 2018 May;55(5):4009-4029. doi: 10.1007/s12035-017-0589-0. Epub 2017 Jun 1. Mol Neurobiol. 2018. PMID: 28573459 - Dynamin-Like Protein B of Dictyostelium Contributes to Cytokinesis Cooperatively with Other Dynamins.
Fujimoto K, Tanaka M, Rana AYKMM, Jahan MGS, Itoh G, Tsujioka M, Uyeda TQP, Miyagishima SY, Yumura S. Fujimoto K, et al. Cells. 2019 Jul 26;8(8):781. doi: 10.3390/cells8080781. Cells. 2019. PMID: 31357517 Free PMC article. - Microtubule assembly by tau impairs endocytosis and neurotransmission via dynamin sequestration in Alzheimer's disease synapse model.
Hori T, Eguchi K, Wang HY, Miyasaka T, Guillaud L, Taoufiq Z, Mahapatra S, Yamada H, Takei K, Takahashi T. Hori T, et al. Elife. 2022 Apr 26;11:e73542. doi: 10.7554/eLife.73542. Elife. 2022. PMID: 35471147 Free PMC article.
References
- Bubb MR, Spector I, Beyer BB, Fosen KM. Effects of jasplakinolide on the kinetics of actin polymerization. An explanation for certain in vivo observations. J Biol Chem. 2000;275:5163–5170. - PubMed
Publication types
MeSH terms
Substances
LinkOut - more resources
Full Text Sources
Other Literature Sources
Molecular Biology Databases
Miscellaneous


