Antigen-specific memory regulatory CD4+Foxp3+ T cells control memory responses to influenza virus infection - PubMed (original) (raw)
Antigen-specific memory regulatory CD4+Foxp3+ T cells control memory responses to influenza virus infection
Erik L Brincks et al. J Immunol. 2013.
Abstract
Regulatory CD4(+)Foxp3(+) T cells (Tregs) are key regulators of inflammatory responses and control the magnitude of cellular immune responses to viral infections. However, little is known about how Tregs contribute to immune regulation during memory responses to previously encountered pathogens. In this study, we used MHC class II tetramers specific for the 311-325 peptide from influenza nucleoprotein (NP311-325/IA(b)) to track the Ag-specific Treg response to primary and secondary influenza virus infections. During secondary infections, Ag-specific memory Tregs showed accelerated accumulation in the lung-draining lymph node and lung parenchyma relative to a primary infection. Memory Tregs effectively controlled the in vitro proliferation of memory CD8(+) cells in an Ag-specific fashion that was MHC class II dependent. When memory Tregs were depleted before secondary infection, the magnitude of the Ag-specific memory CD8(+) T cell response was increased, as was pulmonary inflammation and airway cytokine/chemokine expression. Replacement of memory Tregs with naive Tregs failed to restore the regulation of the memory CD8 T cell response during secondary infection. Together, these data demonstrate the existence of a previously undescribed population of Ag-specific memory Tregs that shape the cellular immune response to secondary influenza virus challenges and offer an additional parameter to consider when determining the efficacy of vaccinations.
Figures
Figure 1. Influenza virus infection induces recruitment of antigen-specific T regulatory cells to the lung and lung-draining lymph node
C57BL/6 mice were sacrificed at indicated times after primary (600 EID50 PR8 influenza virus) or secondary (60,000 EID50 PR8 influenza virus) infection and lymphocytes harvested from the lung (A–D) or the lung-draining lymph node (E–H) were stained for CD4, FoxP3, and NP311/I-Ab tetramer. (A and E) Total Treg CD4+FoxP3+ cells per lung (A) or draining lymph node (E) at various days after primary (●) or secondary (Δ) infection. (B and F) Representative plots from the lung (B) and dLN (F) gated on total CD4+ cells in tissue. (C and G) Antigen-specific Treg NP311/I-Ab+CD4+FoxP3+ cells per lung (C) or draining lymph node (G) at various days after primary (●) or secondary (Δ) infection. (D and H) Antigen-specific Treg NP311/I-Ab+CD4+FoxP3neg cells per lung (D) or draining lymph node (H) at various days after primary (●) or secondary (Δ) infection. For A, C, D, E, G, and H, significance was determined utilizing a two-way ANOVA. Subsequent analysis of individual timepoint significance was determined by Bonferroni post hoc tests; significance (*) indicates p < 0.05. Data are from four to five mice per time point in two independent experiments. Error bars indicate mean ± SD.
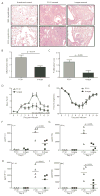
Figure 2. Depletion of Treg populations during influenza virus infection results in increased pulmonary inflammation
C57BL/6 mice were infected with 3000 EID50 x31 influenza virus and allowed to rest for 35 days. Mice were treated with PC61 or isotype control, then challenged with 60,000 EID50 PR8 influenza virus. On day 5 post-infection, whole lungs were harvested, fixed, sectioned, and H&E stained. (A) Representative lung tissue sections of uninfected lungs; lungs from infected, PC61-treated mice; or lungs from infected isotype-treated mice. (B and C) Lung sections were scored for inflammation (B) and proliferation (C). Data are representative of 2 independent experiments that included 4 mice per group. Error bars indicate mean ± SD. Differences between the histology scoring data were determined by the Mann-Whitney U non-parametric test. (D) A whole body pleythsmograph was used to measure airway resistance on a daily basis after challenge. The baseline enhanced pause (Penh) is shown as mean ± SD. Data shown are are representative of 2 independent experiments that included 4 mice per group. (E) Weight loss was used as a measure of morbidity on a daily basis after challenge. Data show body weight as a percentage of weight at time of infection. Data are representative of 2 independent experiments and include 4–5 mice per group. (F through I) BAL fluid was harvested and analyzed for the pro-inflammatory cytokines IL-6 (F) and IFNγ (G) and chemokines IP10 (H) and MIG (I). For B, C, F, G, H, and I, differences between groups were determined by student t test. For D and E, significance was determined utilizing a two-way ANOVA. Subsequent analysis of individual timepoint significance was determined by Bonferroni post hoc tests; significance (*) indicates p < 0.05.
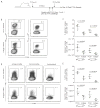
Figure 3. Memory Treg regulate the magnitude of in vivo influenza-specific CD8 T cell responses to secondary challenge
C57BL/6 mice were infected with 3000 EID50 x31 influenza virus and allowed to rest for 35 days. Mice were treated with PC61 or isotype control, then challenged with 60,000 EID50 PR8 influenza virus and sacrificed at day 5 post-infection. (A) Schematic of experimental design that outlines infections, antibody treatments, and harvests. (B and C) Lymphocytes were isolated from the lungs and stained with influenza NP366/Db tetramer or PA224/Db tetramer. (B) Representative staining of influenza-specific CD8 T cell responses in the lung. Plots are gated on CD8+ cells. (C) Percentage of tetramer positive cells among total CD8+ cells in the lung (top panel), and total tetramer positive cells per lung (bottom panel). (D and E) Lymphocytes were isolated from the lungs and analyzed for IFNγ production after peptide stimulation. (D) Representative plots for IFNγ production by CD8+ T cells after stimulation with NP366 peptide-pulsed, PA224 peptide-pulsed, or unpulsed antigen presenting cells. (E) Percentage of IFNγ positive cells among total CD8+ cells in the lung (top panel). Total IFNγ positive cells per lung (bottom panel). Data points represent individual mice. Lines represent mean. Error bars represent SD. Data are representative of 3 independent experiments. Differences between groups were determined by student t tests.
Figure 4. Memory Treg are required to regulate the magnitude of in vivo influenza-specific CD8 T cell responses to secondary challenge
FoxP3-DTR mice were infected with 3000 EID50 x31 influenza virus and allowed to rest for 35 days. Mice were treated with diphtheria toxin or vehicle, then challenged with 60,000 EID50 PR8 influenza virus. In some mice, naïve Treg were adoptively transferred prior to infection. Mice were sacrificed at day 5 post-infection. Lymphocytes were isolated from the lungs and stained with influenza NP366/Db tetramer or PA224/Db tetramer. (A) Schematic of experimental design that outlines infections, diphtheria toxin treatments, adoptive transfer, and harvest. (B) Representative plots from the lung (top row) and dLN (bottom row) gated on total CD4+ cells in tissue harvested from mice treated with diphtheria toxin (DT), treated with diphtheria toxin with a transfer of naïve Treg (DT + Treg), or untreated (PBS). (C) Total FoxP3+CD4+ cells per tissue for both the lung (left panel) and the lung-draining lymph node (right panel). (D) Total influenza NP366/Db tetramer positive cells among total CD8+ cells in the lung. (E) Total influenza PA224/Db tetramer positive cells among total CD8+ cells in the lung. Data points in (D) and (E) represent individual mice. Lines represent mean. Error bars represent SD. Data are representative of 2 independent experiments of 3–4 mice per group. Differences between groups were determined by student t tests; significance (*) indicates p < 0.05.
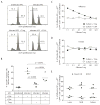
Figure 5. Treg responding to influenza virus challenge inhibit memory T cell proliferation in an antigen-specific fashion
FoxP3-GFP mice were infected with 3000 EID50 x31 influenza virus and allowed to rest for 35 days. Mice were then challenged with 60,000 EID50 PR8 influenza virus and sacrificed at day 4 post-infection. Lymphocytes were isolated from the lungs, dLN, and spleen, enriched for CD4+ cells, and sorted into GFP+ (Treg) and GFP− (CD4 effector) populations and used to inhibit the proliferation of influenza-specific CD8 T cells stimulated with influenza-infected antigen-presenting cells. (A) Representative histograms demonstrating the inhibition of CD8 T cell proliferation when Treg are added to wells. Histogram plots are gated on congenic marker+CD8+ cells. (B) The frequency of total CD8+ effector cells that had proliferated after co-culture with influenza-infected antigen-presenting cells. Data points represent individual wells; bar represents mean. Data in A and B are representative of 2 independent experiments, in which cells were pooled from 12–15 FoxP3-GFP mice for each experiment. (C and D) To assess proliferation of antigen-specific CD8 T cells, influenza-specific Treg were used to suppress proliferation of either influenza-specific CD8 T cells (in C) or Sendai virus-specific CD8 T cells (in D). To identify antigen-specific effector T cells, cells from proliferation assays were stained with influenza NP366/Db tetramer (in C) or Sendai NP324Kb tetramer (in D). The frequency of tet+CD8+ that had not proliferated is displayed for each ratio of CD8:Treg (■) or CD8:CD4 (□). Data from C and D are concatenated from 4–5 wells for each ratio. Data in C and D are representative of 3 independent experiments, in which cells were pooled from 12–15 FoxP3-GFP mice for each experiment. (E) To assess the requirement of MHC Class II for Treg function, influenza-specific Treg from lung, dLN, or spleen were used to suppress proliferation of influenza-specific CD8 T cells in cultures with influenza-infected WT (■) or ClassII knockout (●) antigen-presenting cells. Cells from proliferation assays were stained with influenza NP366/Db tetramer. The frequency of tet+CD8+ that had not proliferated is displayed for each tissue. Data points represent individual wells; bar represents mean. Data in E are representative of 3 independent experiments, in which cells were pooled from 12–15 FoxP3-GFP mice for each experiment.
Similar articles
- Foxp3+ CD4 regulatory T cells limit pulmonary immunopathology by modulating the CD8 T cell response during respiratory syncytial virus infection.
Fulton RB, Meyerholz DK, Varga SM. Fulton RB, et al. J Immunol. 2010 Aug 15;185(4):2382-92. doi: 10.4049/jimmunol.1000423. Epub 2010 Jul 16. J Immunol. 2010. PMID: 20639494 Free PMC article. - Influenza virus infection selectively triggers the accumulation and persistence of more potent Helios-expressing Foxp3+ regulatory T cells in the lungs.
Lu C, Chen W. Lu C, et al. Immunol Cell Biol. 2021 Nov;99(10):1011-1025. doi: 10.1111/imcb.12492. Epub 2021 Aug 15. Immunol Cell Biol. 2021. PMID: 34251701 - Control of innate immunity by memory CD4 T cells.
Strutt TM, McKinstry KK, Swain SL. Strutt TM, et al. Adv Exp Med Biol. 2011;780:57-68. doi: 10.1007/978-1-4419-5632-3_6. Adv Exp Med Biol. 2011. PMID: 21842365 Free PMC article. Review. - Primary and long-term B-cell responses in the upper airway and lung after influenza A virus infection.
Boyden AW, Frickman AM, Legge KL, Waldschmidt TJ. Boyden AW, et al. Immunol Res. 2014 Aug;59(1-3):73-80. doi: 10.1007/s12026-014-8541-0. Immunol Res. 2014. PMID: 24838149 Review.
Cited by
- Regulatory T cells restrict immunity and pathology in distal tissue sites following a localized infection.
Graham JB, Swarts JL, Koehne AL, Watson CE, Lund JM. Graham JB, et al. Mucosal Immunol. 2024 Oct;17(5):923-938. doi: 10.1016/j.mucimm.2024.06.007. Epub 2024 Jun 20. Mucosal Immunol. 2024. PMID: 38908483 Free PMC article. - A guide to adaptive immune memory.
Lam N, Lee Y, Farber DL. Lam N, et al. Nat Rev Immunol. 2024 Nov;24(11):810-829. doi: 10.1038/s41577-024-01040-6. Epub 2024 Jun 3. Nat Rev Immunol. 2024. PMID: 38831162 Review. - Ex Pluribus Unum: The CD4 T Cell Response against Influenza A Virus.
Finn CM, McKinstry KK. Finn CM, et al. Cells. 2024 Apr 5;13(7):639. doi: 10.3390/cells13070639. Cells. 2024. PMID: 38607077 Free PMC article. Review. - Convergence, plasticity, and tissue residence of regulatory T cell response via TCR repertoire prism.
Nakonechnaya TO, Moltedo B, Putintseva EV, Leyn S, Bolotin DA, Britanova OV, Shugay M, Chudakov DM. Nakonechnaya TO, et al. Elife. 2024 Apr 9;12:RP89382. doi: 10.7554/eLife.89382. Elife. 2024. PMID: 38591522 Free PMC article. - Regulatory T cells: Supporting lung homeostasis and promoting resolution and repair after lung injury.
McCullough MJ, Bose PG, Mock JR. McCullough MJ, et al. Int J Biochem Cell Biol. 2024 May;170:106568. doi: 10.1016/j.biocel.2024.106568. Epub 2024 Mar 20. Int J Biochem Cell Biol. 2024. PMID: 38518980 Review.
References
- Belkaid Y, Rouse BT. Natural regulatory T cells in infectious disease. Nat Immunol. 2005;6:353–360. - PubMed
Publication types
MeSH terms
Substances
LinkOut - more resources
Full Text Sources
Other Literature Sources
Molecular Biology Databases
Research Materials


