Cell reprogramming requires silencing of a core subset of polycomb targets - PubMed (original) (raw)
doi: 10.1371/journal.pgen.1003292. Epub 2013 Feb 28.
Pierre-Luc Germain, Pasquale Laise, Alessandro Cuomo, Alessandro Blasimme, Fridolin Gross, Elena Signaroldi, Gabriele Bucci, Cesar Sommer, Giancarlo Pruneri, Giovanni Mazzarol, Tiziana Bonaldi, Gustavo Mostoslavsky, Stefano Casola, Giuseppe Testa
Affiliations
- PMID: 23468641
- PMCID: PMC3585017
- DOI: 10.1371/journal.pgen.1003292
Cell reprogramming requires silencing of a core subset of polycomb targets
Giulia Fragola et al. PLoS Genet. 2013.
Abstract
Transcription factor (TF)-induced reprogramming of somatic cells into induced pluripotent stem cells (iPSC) is associated with genome-wide changes in chromatin modifications. Polycomb-mediated histone H3 lysine-27 trimethylation (H3K27me3) has been proposed as a defining mark that distinguishes the somatic from the iPSC epigenome. Here, we dissected the functional role of H3K27me3 in TF-induced reprogramming through the inactivation of the H3K27 methylase EZH2 at the onset of reprogramming. Our results demonstrate that surprisingly the establishment of functional iPSC proceeds despite global loss of H3K27me3. iPSC lacking EZH2 efficiently silenced the somatic transcriptome and differentiated into tissues derived from the three germ layers. Remarkably, the genome-wide analysis of H3K27me3 in Ezh2 mutant iPSC cells revealed the retention of this mark on a highly selected group of Polycomb targets enriched for developmental regulators controlling the expression of lineage specific genes. Erasure of H3K27me3 from these targets led to a striking impairment in TF-induced reprogramming. These results indicate that PRC2-mediated H3K27 trimethylation is required on a highly selective core of Polycomb targets whose repression enables TF-dependent cell reprogramming.
Conflict of interest statement
The authors have declared that no competing interests exist.
Figures
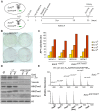
Figure 1. Derivation and biochemical analysis of iPSC upon conditional Ezh2 inactivation.
A. Diagram of the reprogramming protocol of MEF. B. Alkaline phosphatase staining of control (lower row) and mutant (upper row) primary iPSC colonies one week following doxycycline withdrawal. C. Number of AP-positive primary iPSC colonies obtained upon infection of, respectively, 2×10³, 5×10³, 1×10⁴ or 6×10⁴ MEF in two experiments performed with two biological replicates per genotype. D. EZH2, H3K27me1, H3K27me2 and H3K27me3 protein levels assessed by Western blot in two representative Ezh2 control (+/+) and mutant (ΔSET/ΔSET) iPSC clones. Vinculin and Histone H3 were used as loading controls for, respectively, EZH2 and methylated forms of H3K27. E. Relative abundance in control (upper row) and mutant (lower row) iPSC clones of the six possible methylation isoforms of the Histone H3 peptide spanning amino acids 27–40, as determined by mass spectrometry.
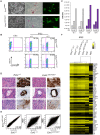
Figure 2. Characterization of pluripotency in iPSC clones reprogrammed upon Ezh2 inactivation.
A. Images of phase contrast (left), alkaline phosphatase staining (middle) and _Oct4_-driven GFP fluorescence (right) of representative control (Ezh2+/ΔSET, upper row) and mutant (Ezh2ΔSET/ΔSET, lower row) iPSC colonies. B. Flow cytometric analysis of SSEA-1 and endogenous OCT4 (OCT4-GFP) levels in representative control (Ezh2+/ΔSET, upper row) and mutant (Ezh2ΔSET/ΔSET, lower row) iPSC clones (cl.1 and cl.2). Embryonic stem cells (ESC) were used as positive control for SSEA1 expression (upper left). C. Growth curve of representative control (Ezh+/+, grey) and mutant (Ezh2ΔSET/ΔSET, purple) iPSC clones cultured in 2i/LIF medium for the indicated hours. Column height represents cell number. D. Hematoxylin & eosin staining and immunohistochemical analysis of representative sections of teratomas generated from either Ezh2 control (Ezh2+/+) or mutant (Ezh2ΔSET/ΔSET) iPSC cells of two representative clones. Stainings for mesoderm (upper row), endoderm (middle row) and ectoderm (lower row) markers are displayed. Data displayed in A, B, C and D are representative of at least four independent experiments, using two iPSC clones per genotype. E. Scatter plots showing global gene expression correlation analyses between Ezh2+/+ and Ezh2ΔSET/ΔSET iPSC (left panel), Ezh2+/+ iPSCs and MEF (central panel) and Ezh2ΔSET/ΔSET iPSC and MEF (right panel). Correlation coefficients (r) reveal the degree of similarity for each comparison. Genes within red lines differ less than 1.5-fold. F. Heat map representation of expression levels of genes involved in pluripotency, stemness and differentiation in two control (Ezh2+/+, first and second column) and two mutant (Ezh2ΔSET/ΔSET, third and fourth column) iPSC clones. ESC (fifth column) and MEF (last column) were used for comparison. Colors range from yellow (low dCt, higher expression) to black (high dCt, lower expression). Hierarchical clustering of samples is also shown.
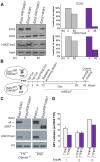
Figure 3. Establishment of iPSC clones upon genome-wide erasure of H3K27me3 at the onset of reprogramming.
A. Western blot analysis of EZH2 and H3K27me3 protein levels respectively at onset or 48 hr after reprogramming in Ezh2+/ΔSET and Ezh2ΔSET/ΔSET MEFs. Data are representative of two experiments. Quantification of protein levels at the indicated time points is shown in the right panel (controls in grey, mutants in purple). B. Strategy to induce reprogramming of tail tip fibroblasts (TTFs) lacking H3K27me3 at the onset of reprogramming. C. Western blot analysis of EZH2 and H3K27me3 protein levels in Cdkn2a−/− TTF carrying either one (+/_Δ_SET) or both (_Δ_SET/_Δ_SET) Ezh2 mutant alleles. As comparison, representative _Ezh2_-proficient (+/+) and -deficient (_Δ_SET/_Δ_SET) iPSC clones were analyzed. The band corresponding to H3K27me3 in mutant TTF has the same intensity of that from a mutant iPSC clone for which mass-spectrometry did not detect the presence of H3K27me3. D. Quantification of AP-positive primary iPSC colonies obtained from infection of 2.5×10³ Cdkn2a−/− TTF, respectively proficient (grey bar) or deficient (purple) for Ezh2, assessed in three independent experiments.
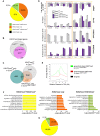
Figure 4. Genome-wide distribution of H3K27me3 in Ezh2ΔSET/ΔSET iPSC revealed through ChIP–seq.
A. Pie chart showing partition of Polycomb targets based on H3K27 methylation status in Ezh2ΔSET/ΔSET iPSCs. B. Venn diagram displaying overlap between H3K27me3+ genes in Ezh2 +/+ (grey) and Ezh2ΔSET/ΔSET (purple) iPSC. C. Venn diagram showing overlap between H3K27me3+ genes in Ezh2 +/+ iPSC (grey), H3K27me2+/H3K27me3− genes in Ezh2ΔSET/ΔSET iPSC (orange) and H3K27me2+/H3K27me3− in Ezh2 +/+ iPSC (light blue). D. Analysis of transcript levels measured by qRT-PCR, and status of SUZ12 binding, H3K27me2 and H3K27me1 enrichment revealed by ChIP q-PCR at promoters of 7 genes overexpressed in MEF relative to iPSC and representative of groups of genes marked by either H3K27me2+/H3K27me3+ or H3K27me2+/H3K27me3− in Ezh2ΔSET/ΔSET iPSC. For all analyses, two Ezh2 control (+/+; grey) iPSC clones were compared to two mutant (_Δ_SET/_Δ_SET; purple) counterparts. Levels of expression are shown as ddCt (log2 scale) relative to MEF. Status of a particular histone modification (±SEM) is represented as fold change of enrichment relative to input, after normalization for H3 density within the same amplicon. SUZ12 enrichment at promoters of indicated genes was determined comparing it to that of an unrelated IgG. Error bars refer to qPCR triplicates. E. Average reads distribution of H3K27me3 around the TSS in Ezh2 +/+ iPSC. Genes were divided in two classes based on H3K27me3 status in Ezh2ΔSET/ΔSET iPSC (H3K27me3+ genes in green, H3K27me3− genes in red) and compared to all genes (black) F. Gene ontology analysis of genes belonging to the three main groups based on H3K27 methylation status in Ezh2ΔSET/ΔSET iPSC depicted in panel A. Bars represent _P_-values in –Log2 scale of the corresponding biological processes. Dashed lines identify the significance threshold. G. Pie chart of H3K27 methylation status in Ezh2ΔSET/ΔSET iPSC of MEF specific genes marked by H3K27me3 in Ezh2 +/+ iPSC. Color code is shown in panel A.
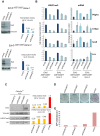
Figure 5. Effect of PRC2 inactivation on established Ezh2ΔSET/ΔSET iPSC clones and TF–induced reprogramming.
A. Western blot analysis of EED protein levels in two Ezh2ΔSET/ΔSET iPSC clones infected with control virus (empty) or lentiviruses expressing independent short hairpin (sh) RNAs targeting Eed (#19 and #21)(left). Quantification of EED protein levels in infected cells after normalization based on Vinculin levels (right). B. H3K27me3 status (left panel) and expression levels (right panel) measured respectively by ChIP-qPCR and qRT-PCR, of 4 representative genes up regulated in MEF relative to iPSC, in two Ezh2ΔSET/ΔSET iPSC clones. _Ezh2_-mutant iPSC were infected with viruses expressing two independent hairpins for Eed or with a control virus. Status of H3K27me3 (±SEM) is represented as enrichment relative to input, after normalization for H3 density within the same amplicon. Expression levels are shown as fold change relative to iPSC infected with the empty vector. Error bars refer to qPCR triplicates. C. Western blot analysis of EED and H3K27me3 protein levels at day-6 of puromycin selection on _Cdkn2a−/− Ezh2_-proficient TTF expressing three independent Eed hairpins (lines 1, 2 and 3) or infected with a control virus (line 4). Quantification of protein levels relative to Vinculin or Histone H3 are shown in the right panel. D. AP staining of primary iPSC colonies obtained upon reprogramming of 1×10³ (upper panel) _Cdkn2a−/− Ezh2_-proficient TTF expressing three independent Eed hairpins (lines 1, 2 and 3) or infected with an empty lentiviral vector (line 4) used as control. E. Quantification of AP+ iPSC colonies. Column height represents number of AP+ iPSC colonies obtained from 1×10³ TTF expressing either one of the three independent Eed hairpins (lines 1, 2 and 3) or infected with an empty lentivirus vector (line 4) as control. Data are representative of two independent experiments performed using three different shRNAs.
Similar articles
- Polycomb-mediated genome architecture enables long-range spreading of H3K27 methylation.
Kraft K, Yost KE, Murphy SE, Magg A, Long Y, Corces MR, Granja JM, Wittler L, Mundlos S, Cech TR, Boettiger AN, Chang HY. Kraft K, et al. Proc Natl Acad Sci U S A. 2022 May 31;119(22):e2201883119. doi: 10.1073/pnas.2201883119. Epub 2022 May 26. Proc Natl Acad Sci U S A. 2022. PMID: 35617427 Free PMC article. - EZH2 variants differentially regulate polycomb repressive complex 2 in histone methylation and cell differentiation.
Mu W, Starmer J, Yee D, Magnuson T. Mu W, et al. Epigenetics Chromatin. 2018 Dec 6;11(1):71. doi: 10.1186/s13072-018-0242-9. Epigenetics Chromatin. 2018. PMID: 30522506 Free PMC article. - Ezh2 mediated H3K27me3 activity facilitates somatic transition during human pluripotent reprogramming.
Rao RA, Dhele N, Cheemadan S, Ketkar A, Jayandharan GR, Palakodeti D, Rampalli S. Rao RA, et al. Sci Rep. 2015 Feb 4;5:8229. doi: 10.1038/srep08229. Sci Rep. 2015. PMID: 25648270 Free PMC article. - JMJD3 as an epigenetic regulator in development and disease.
Burchfield JS, Li Q, Wang HY, Wang RF. Burchfield JS, et al. Int J Biochem Cell Biol. 2015 Oct;67:148-57. doi: 10.1016/j.biocel.2015.07.006. Epub 2015 Jul 17. Int J Biochem Cell Biol. 2015. PMID: 26193001 Free PMC article. Review. - Tissue-Specific Tumour Suppressor and Oncogenic Activities of the Polycomb-like Protein MTF2.
Ngubo M, Moradi F, Ito CY, Stanford WL. Ngubo M, et al. Genes (Basel). 2023 Sep 27;14(10):1879. doi: 10.3390/genes14101879. Genes (Basel). 2023. PMID: 37895228 Free PMC article. Review.
Cited by
- Polycomb group proteins and MYC: the cancer connection.
Benetatos L, Vartholomatos G, Hatzimichael E. Benetatos L, et al. Cell Mol Life Sci. 2014 Jan;71(2):257-69. doi: 10.1007/s00018-013-1426-x. Epub 2013 Jul 30. Cell Mol Life Sci. 2014. PMID: 23897499 Free PMC article. Review. - Reprogramming: identifying the mechanisms that safeguard cell identity.
Brumbaugh J, Di Stefano B, Hochedlinger K. Brumbaugh J, et al. Development. 2019 Dec 2;146(23):dev182170. doi: 10.1242/dev.182170. Development. 2019. PMID: 31792064 Free PMC article. Review. - Reprogramming of cell fate: epigenetic memory and the erasure of memories past.
Nashun B, Hill PW, Hajkova P. Nashun B, et al. EMBO J. 2015 May 12;34(10):1296-308. doi: 10.15252/embj.201490649. Epub 2015 Mar 27. EMBO J. 2015. PMID: 25820261 Free PMC article. Review. - Demethylation of H3K27 Is Essential for the Induction of Direct Cardiac Reprogramming by miR Combo.
Dal-Pra S, Hodgkinson CP, Mirotsou M, Kirste I, Dzau VJ. Dal-Pra S, et al. Circ Res. 2017 Apr 28;120(9):1403-1413. doi: 10.1161/CIRCRESAHA.116.308741. Epub 2017 Feb 16. Circ Res. 2017. PMID: 28209718 Free PMC article. - Role of Hepatic-Specific Transcription Factors and Polycomb Repressive Complex 2 during Induction of Fibroblasts to Hepatic Fate.
Rastegar-Pouyani S, Khazaei N, Wee P, Mohammadnia A, Yaqubi M. Rastegar-Pouyani S, et al. PLoS One. 2016 Nov 30;11(11):e0167081. doi: 10.1371/journal.pone.0167081. eCollection 2016. PLoS One. 2016. PMID: 27902735 Free PMC article.
References
- Davis RL, Weintraub H, Lassar AB (1987) Expression of a single transfected cDNA converts fibroblasts to myoblasts. Cell 51: 987–1000. - PubMed
- Takahashi K, Yamanaka S (2006) Induction of pluripotent stem cells from mouse embryonic and adult fibroblast cultures by defined factors. Cell 126: 663–676. - PubMed
- Li R, Liang J, Ni S, Zhou T, Qing X, et al. (2010) A mesenchymal-to-epithelial transition initiates and is required for the nuclear reprogramming of mouse fibroblasts. Cell Stem Cell 7: 51–63. - PubMed
- Samavarchi-Tehrani P, Golipour A, David L, Sung HK, Beyer TA, et al. (2010) Functional genomics reveals a BMP-driven mesenchymal-to-epithelial transition in the initiation of somatic cell reprogramming. Cell Stem Cell 7: 64–77. - PubMed
Publication types
MeSH terms
Substances
Grants and funding
This work was funded by the Italian Ministry of Health (through the “Progetto Giovani Ricercatori”)(S Casola, G Testa, G Pruneri), the Italian Association for Cancer Research (AIRC)(S Casola, G Testa), the Cariplo Foundation (S Casola, G Testa), and the Italian National Research Council (CNR) Epigen Flagship Project (G Testa). S Casola is supported by the FIRC Foundation and the Giovanni Armenise-Harvard Foundation. The funders had no role in study design, data collection and analysis, decision to publish, or preparation of the manuscript.
LinkOut - more resources
Full Text Sources
Other Literature Sources
Molecular Biology Databases
Miscellaneous
