IL-12 receptor β1 deficiency alters in vivo T follicular helper cell response in humans - PubMed (original) (raw)
Comparative Study
. 2013 Apr 25;121(17):3375-85.
doi: 10.1182/blood-2012-08-448902. Epub 2013 Mar 8.
Jacinta Bustamante, Laure Bourdery, Salah Eddine Bentebibel, Stephanie Boisson-Dupuis, Fran Hamlin, Mau V Tran, Derek Blankenship, Virginia Pascual, Daniel A Savino, Jacques Banchereau, Jean-Laurent Casanova, Hideki Ueno
Affiliations
- PMID: 23476048
- PMCID: PMC3637013
- DOI: 10.1182/blood-2012-08-448902
Comparative Study
IL-12 receptor β1 deficiency alters in vivo T follicular helper cell response in humans
Nathalie Schmitt et al. Blood. 2013.
Abstract
Antibody responses represent a key immune protection mechanism. T follicular helper (Tfh) cells are the major CD4(+) T-cell subset that provides help to B cells to generate an antibody response. Tfh cells together with B cells form germinal centers (GCs), the site where high-affinity B cells are selected and differentiate into either memory B cells or long-lived plasma cells. We show here that interleukin-12 receptor β1 (IL-12Rβ1)-mediated signaling is important for in vivo Tfh response in humans. Although not prone to B cell-deficient-associated infections, subjects lacking functional IL-12Rβ1, a receptor for IL-12 and IL-23, displayed substantially less circulating memory Tfh and memory B cells than control subjects. GC formation in lymph nodes was also impaired in IL-12Rβ1-deficient subjects. Consistently, the avidity of tetanus toxoid-specific serum antibodies was substantially lower in these subjects than in age-matched controls. Tfh cells in tonsils from control individuals displayed the active form of signal transducer and activator of transcription 4 (STAT4), demonstrating that IL-12 is also acting on Tfh cells in GCs. Thus, our study shows that the IL-12-STAT4 axis is associated with the development and the functions of Tfh cells in vivo in humans.
Figures
Figure 1
IL-12 and IL-23 induce naïve CD4+ T cells to express multiple Tfh-associated molecules. Human naïve CD4+ T cells were stimulated with CD3-CD28 mAb-coated beads in the presence of the indicated cytokines to analyze expression of Tfh-associated molecules. (A-C) Expression of IL-21 (after 6-hour restimulation with PMA and ionomycin), CXCR5, and ICOS on day 3. (A) A representative result of IL-21 expression. (B) A representative result of CXCR5 and ICOS expression. (C) Each dot represents data obtained from different donors. Mean ± standard deviation (SD); n = 3-13. One-way ANOVA: *P < .05; **P < .01; and ***P < .001. (D) Expression of BCL6, PRDM1, BATF, and MAF transcripts of CD4+ T cells cultured for 2 days. Abundance of transcripts was measured by Nanostring. Normalized to the abundance in the control conditions following gene normalization with 7 housekeeping genes. Mean ± SD; n = 3. One-way ANOVA. (E) Analysis of Bcl-6 expression by flow cytometry. CD4+ T cells were primed for 3 days in the presence of indicated cytokines. Mean ± SD; n = 3. One-way ANOVA.
Figure 2
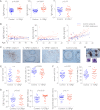
IL-12Rβ1–deficient subjects display less CXCR5+ CD4+ T cells in blood. (A) Representative results of CXCR5 expression on blood CD4+ T cells. (B) Percentage of CXCR5+ cells within (left) total or (right) memory CD4+ T cells. Percentage of memory cells within total CD4+ T cells is shown in the center. Each dot represents a sample from either control subjects (n = 68, blue) or IL-12Rβ1–deficient subjects (n = 22, orange). Unpaired Student t test. (C) Mean fluorescent intensity of CXCR5 of CXCR5+ CD4+ T cells. (D) Percentage of CXCR5+ cells within (left) total and (right) memory CD4+ T cells at different ages. Each dot represents a sample from an individual subject. Linear regression and 95% confidence interval in each group (control or IL-12Rβ1 deficient) are indicated by solid lines and dotted lines, respectively. (E) Percentages of CXCR5+ cells within CD45RA−CD4+ T cells in groups of age <10. (F) CXCR5 expression in IL-12Rβ1–deficient subjects with different BCG vaccination/dissemination history. D, BCG disseminated; NV, not BCG vaccinated; R, subjects who remained asymptomatic (resistant) after BCG vaccination.
Figure 3
IL-12Rβ1–deficient subjects display less memory B cells in blood. (A) Representative results of phenotypic analysis of blood B-cell subsets. (B) Frequency of naïve (IgD+CD27−), IgD−CD27+ memory, and IgD+CD27+ nonswitched memory cells within CD20+ B cells in control subjects (n = 61, blue) or IL-12Rβ1–deficient subjects (n = 15, orange). Unpaired Student t test. (C) Composition of blood B-cell subsets at different ages. Each dot represents a sample from an individual subject. Linear regression and 95% confidence interval in each group (control or IL-12Rβ1 deficient) are indicated by solid lines and dotted lines, respectively.
Figure 4
IL-12Rβ1–deficient subjects altered GC responses. Alteration of GC formation in IL-12Rβ1–deficient subjects. Immunohistochemistry staining of peripheral LN samples from IL-12Rβ1–deficient subjects and tonsil samples from control subjects. Samples were stained with (A) H&E, (B) CD20 mAb, (C) CD3 polyclonal Ab, (D) CD4 mAb, (E) CD57 mAb, (F) Bcl-6 mAb, and (G) AID mAb. T-B cell aggregates in subjects 1 and 2 are indicated by dotted lines. In control tonsils, secondary follicles are indicated by dotted lines, and the solid lines indicate the border between the mantle zone (MZ) and the GC. Bar equals 100 μm. (H) CD57+ cells per T-B cell aggregates. CD57+ cells were counted within the T-B cell aggregates in subject 2 LNs, and within GCs with a similar size present in tonsils from 3 control subjects. Student t test.
Figure 5
IL-12Rβ1–deficient subjects display low-avidity TT-specific IgG. (A) Serum IgM, IgG, and IgA levels in IL-12Rβ1–deficient subjects (n = 25) and control subjects (n = 38). Student t test. (B) Serum Ig levels at different ages. Each dot represents a sample from an individual subject. Linear regression and 95% confidence interval in each group (control or IL-12Rβ1 deficient) are indicated by solid lines and dotted lines, respectively. (C) CD138 staining of peripheral LN samples from IL-12Rβ1–deficient subjects and tonsil samples from control subjects. T-B cell aggregates in subject 2 are indicated by dotted lines. In control tonsils, secondary follicles are indicated by dotted lines, and the solid lines indicate the border between the mantle zone (MZ) and the GC. Bar equals 100 μm. (D) CD138+ cells with plasma cell morphology. Bar equals 10 μm. (E) TT-specific IgG of serum samples were assessed by enzyme-linked immunosorbent assay. IgG avidity was assessed by the index calculated as a percentage: (OD after urea treatment/OD of the reference well) × 100. (F) Rubella virus–specific IgG levels and their avidities were assessed by enzyme-linked immunosorbent assay. (G) Serum IgG levels against Epstein-Barr virus, cytomegalovirus, and varicella virus in IL-12Rβ1–deficient subjects and control subjects. Student t test.
Figure 6
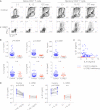
Altered IL-21 secretion by IL-12Rβ1–deficient CD4+ T cells. (A) Intracytoplasmic cytokine expression by naïve and memory CD4+ T cells from an IL-12Rβ1–deficient subject and healthy subjects after 8-day culture with anti-CD3/CD28 and either IL-12 or CD40L-stimulated DC supernatant. (B) Cytokine secretion from PBMCs stimulated for 48 hours with SEB. Mann-Whitney test. Control subjects (blue), n = 65; IL-12Rβ1–deficient subjects (orange), n = 17. (C) Associations between IL-6 concentrations and IL-21 concentrations in culture supernatant of PBMCs stimulated with SEB. (D) Contribution of IL-12 in IL-21 secretion. An (left) IL-12p70 blocking antibody or (right) IL-12 (10 ng/ml) was added to the PBMC cultures with SEB. Paired Student t test. Control subjects (blue), n = 16; IL-12Rβ1–deficient subjects (orange), n = 8.
Figure 7
IL-12/STAT4 signaling in human tonsillar GC Tfh cells. (A) _p_-STAT4 expression by GC Tfh cells. Cells expressing _p_-STAT4 (red) and CD4 (green) in human tonsil were analyzed by confocal microscopy. Blue indicates DAPI staining. DZ, dark zone; FM, follicular mantle; LZ, light zone. Bar equals 100 μm. (B) Nuclear localization of _p_-STAT4 in Tfh cells is shown on the right with DAPI staining. Bar equals 10 μm. (C) Expression of IL-12Rβ1 on tonsillar GC Tfh (CXCR5hiICOShiCD4+ T) cells. (Left) Gating strategy for CXCR5−ICOS−, CXCR5loICOSlo, and CXCR5hiICOShi within CD3+CD4+ T cells. Representative results from 3 independent experiments. (D) IL-21 secretion by tonsillar GC Tfh cells in response to IL-12. Tonsillar Tfh cells were stimulated for 3 days with autologous SEB-pulsed B cells in the presence of IL-12, IL-23, or type I IFNs. Representative results from 3 independent experiments.
Similar articles
- A Subset of CXCR5+CD8+ T Cells in the Germinal Centers From Human Tonsils and Lymph Nodes Help B Cells Produce Immunoglobulins.
Shen J, Luo X, Wu Q, Huang J, Xiao G, Wang L, Yang B, Li H, Wu C. Shen J, et al. Front Immunol. 2018 Oct 5;9:2287. doi: 10.3389/fimmu.2018.02287. eCollection 2018. Front Immunol. 2018. PMID: 30344522 Free PMC article. - CD25(+) Bcl6(low) T follicular helper cells provide help to maturing B cells in germinal centers of human tonsil.
Li H, Pauza CD. Li H, et al. Eur J Immunol. 2015 Jan;45(1):298-308. doi: 10.1002/eji.201444911. Epub 2014 Oct 27. Eur J Immunol. 2015. PMID: 25263533 Free PMC article. - Expansion of circulating T cells resembling follicular helper T cells is a fixed phenotype that identifies a subset of severe systemic lupus erythematosus.
Simpson N, Gatenby PA, Wilson A, Malik S, Fulcher DA, Tangye SG, Manku H, Vyse TJ, Roncador G, Huttley GA, Goodnow CC, Vinuesa CG, Cook MC. Simpson N, et al. Arthritis Rheum. 2010 Jan;62(1):234-44. doi: 10.1002/art.25032. Arthritis Rheum. 2010. PMID: 20039395 - T follicular helper cell heterogeneity: Time, space, and function.
Song W, Craft J. Song W, et al. Immunol Rev. 2019 Mar;288(1):85-96. doi: 10.1111/imr.12740. Immunol Rev. 2019. PMID: 30874350 Free PMC article. Review. - T follicular helper (Tfh ) cells in normal immune responses and in allergic disorders.
Varricchi G, Harker J, Borriello F, Marone G, Durham SR, Shamji MH. Varricchi G, et al. Allergy. 2016 Aug;71(8):1086-94. doi: 10.1111/all.12878. Epub 2016 May 25. Allergy. 2016. PMID: 26970097 Review.
Cited by
- In vitro IL-6/IL-6R Trans-Signaling in Fibroblasts Releases Cytokines That May Be Linked to the Pathogenesis of IgG4-Related Disease.
Zongfei J, Rongyi C, Xiaomeng C, Lili M, Lingying M, Xiufang K, Xiaomin D, Zhuojun Z, Huiyong C, Ying S, Lindi J. Zongfei J, et al. Front Immunol. 2020 Jul 8;11:1272. doi: 10.3389/fimmu.2020.01272. eCollection 2020. Front Immunol. 2020. PMID: 32733444 Free PMC article. - IL-12 signaling drives the differentiation and function of a TH1-derived TFH1-like cell population.
Powell MD, Read KA, Sreekumar BK, Jones DM, Oestreich KJ. Powell MD, et al. Sci Rep. 2019 Sep 30;9(1):13991. doi: 10.1038/s41598-019-50614-1. Sci Rep. 2019. PMID: 31570752 Free PMC article. - The IL-12 Cytokine and Receptor Family in Graft-vs.-Host Disease.
Bastian D, Wu Y, Betts BC, Yu XZ. Bastian D, et al. Front Immunol. 2019 May 8;10:988. doi: 10.3389/fimmu.2019.00988. eCollection 2019. Front Immunol. 2019. PMID: 31139181 Free PMC article. Review. - Regulation of human helper T cell subset differentiation by cytokines.
Schmitt N, Ueno H. Schmitt N, et al. Curr Opin Immunol. 2015 Jun;34:130-6. doi: 10.1016/j.coi.2015.03.007. Epub 2015 Apr 11. Curr Opin Immunol. 2015. PMID: 25879814 Free PMC article. Review. - Genome-wide Analysis Identifies Bcl6-Controlled Regulatory Networks during T Follicular Helper Cell Differentiation.
Liu X, Lu H, Chen T, Nallaparaju KC, Yan X, Tanaka S, Ichiyama K, Zhang X, Zhang L, Wen X, Tian Q, Bian XW, Jin W, Wei L, Dong C. Liu X, et al. Cell Rep. 2016 Feb 23;14(7):1735-1747. doi: 10.1016/j.celrep.2016.01.038. Epub 2016 Feb 11. Cell Rep. 2016. PMID: 26876184 Free PMC article.
References
- Crotty S. Follicular helper CD4 T cells (TFH). Annu Rev Immunol. 2011;29:621–663. - PubMed
- King C, Tangye SG, Mackay CR. T follicular helper (TFH) cells in normal and dysregulated immune responses. Annu Rev Immunol. 2008;26:741–766. - PubMed
- Victora GD, Nussenzweig MC. Germinal centers. Annu Rev Immunol. 2012;30:429–457. - PubMed
Publication types
MeSH terms
Substances
Grants and funding
- U19-AI057234/AI/NIAID NIH HHS/United States
- U19-AI082715/AI/NIAID NIH HHS/United States
- U19 AI057234/AI/NIAID NIH HHS/United States
- U19-AI089987/AI/NIAID NIH HHS/United States
- U19 AI082715/AI/NIAID NIH HHS/United States
- U19 AI089987/AI/NIAID NIH HHS/United States
LinkOut - more resources
Full Text Sources
Other Literature Sources
Research Materials
Miscellaneous


