Identification of a pharmacologically tractable Fra-1/ADORA2B axis promoting breast cancer metastasis - PubMed (original) (raw)
. 2013 Mar 26;110(13):5139-44.
doi: 10.1073/pnas.1222085110. Epub 2013 Mar 12.
Tristan Gallenne, Alexandre Prieur, Fabien Reyal, Nils L Visser, Ben S Wittner, Marjon A Smit, Thomas R Geiger, Jamila Laoukili, Sedef Iskit, Boris Rodenko, Wilbert Zwart, Bastiaan Evers, Hugo Horlings, Abderrahrim Ajouaou, John Zevenhoven, Martin van Vliet, Sridhar Ramaswamy, Lodewyk F A Wessels, Daniel S Peeper
Affiliations
- PMID: 23483055
- PMCID: PMC3612632
- DOI: 10.1073/pnas.1222085110
Identification of a pharmacologically tractable Fra-1/ADORA2B axis promoting breast cancer metastasis
Christophe J Desmet et al. Proc Natl Acad Sci U S A. 2013.
Abstract
Metastasis confronts clinicians with two major challenges: estimating the patient's risk of metastasis and identifying therapeutic targets. Because they are key signal integrators connecting cellular processes to clinical outcome, we aimed to identify transcriptional nodes regulating cancer cell metastasis. Using rodent xenograft models that we previously developed, we identified the transcription factor Fos-related antigen-1 (Fra-1) as a key coordinator of metastasis. Because Fra-1 often is overexpressed in human metastatic breast cancers and has been shown to control their invasive potential in vitro, we aimed to assess the implication and prognostic significance of the Fra-1-dependent genetic program in breast cancer metastasis and to identify potential Fra-1-dependent therapeutic targets. In several in vivo assays in mice, we demonstrate that stable RNAi depletion of Fra-1 from human breast cancer cells strongly suppresses their ability to metastasize. These results support a clinically important role for Fra-1 and the genetic program it controls. We show that a Fra-1-dependent gene-expression signature accurately predicts recurrence of breast cancer. Furthermore, a synthetic lethal drug screen revealed that antagonists of the adenosine receptor A2B (ADORA2B) are preferentially toxic to breast tumor cells expressing Fra-1. Both RNAi silencing and pharmacologic blockade of ADORA2B inhibited filopodia formation and invasive activity of breast cancer cells and correspondingly reduced tumor outgrowth in the lungs. These data show that Fra-1 activity is causally involved in and is a prognostic indicator of breast cancer metastasis. They suggest that Fra-1 activity predicts responsiveness to inhibition of pharmacologically tractable targets, such as ADORA2B, which may be used for clinical interference of metastatic breast cancer.
Conflict of interest statement
Conflict of interest statement: A patent application for the gene-expression classifier described in this paper has been filed with C.J.D., F.R. and D.S.P. as inventors.
Figures
Fig. 1.
Gene-expression profiling of a metastasis model system identifies Fra-1 as a candidate metastasis gene. (A) Microarray gene-expression analysis of RK3ETB and RIETB cells. The top 10 genes that are up- or down-regulated in both cell systems are shown in a heat map. (B) Fra-1 and E-cadherin expression levels measured by Western blotting in RK3ETB cells expressing independent shRNAs targeting Fra-1 as indicated. α-Tubulin serves as loading control. (C) Representative images of macroscopic pulmonary metastases and hematoxylin-eosin staining of histological lung sections from mice injected s.c. with control or Fra-1–depleted RK3ETB cells analyzed 3 wk postinoculation. (Scale bars: 200 μm.) M, metastasis. (D) Macroscopic quantification of pulmonary metastases in mice described in C. Data in B_–_D are representative of three independent experiments.
Fig. 2.
Suppression of Fra-1 abrogates the metastatic potential of human breast cancer cells and restores epithelial characteristics. (A) Expression levels of Fra-1 and epithelial proteins in LM2 cells as a function of Fra-1 depletion measured by Western blotting. α-Tubulin serves as loading control. (B) Representative bioluminescence images of mice injected i.v. with 2 × 10⁵ LM2 cells expressing a control or sh-Fra1 vector at different time points as indicted. (C) Quantification of the luminescence signal in the lungs of mice described in B as a function of time. n = 6. Error bars indicate SE. *P < 0.05, **P < 0.01, ***P < 0.005 vs. control based on a two-tailed Wilcoxon signed-rank test. (D) Kaplan–Meier curves for the survival of the mice described in B and C. Mice were killed when clinical symptoms became apparent. Displayed P value is based on a log-rank test. (E) Immunohistochemical analysis of human vimentin expression (which was retained by Fra-1–depleted cells) identifying metastases formed in the lungs of recipient mice by control or Fra-1–depleted LM2 cells. (Upper) Composite image of the entire left lung. (Lower) Image taken at 20× magnification. (Scale bars: 100 μm.) Data are representative of two (B_–_E) or three (A) independent experiments.
Fig. 3.
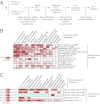
A Fra-1–associated gene-expression profile accurately predicts clinical outcome of human breast cancer. (A) Outline of the procedure used to identify a Fra-1–dependent transcriptome signature in LM2 cells and to derive a prognostic Fra-1 classifier. (B) A heat map representing one-sided Cox proportional hazards model P values for time to distant metastasis (if available) or relapse on breast cancer datasets not used to train the Fra-1 classifier (
SI Appendix, Methods
) for the indicated gene-expression signatures. (C) A heat map representing one-sided log-rank P values between signature-high samples and signature-low samples for time to distant metastasis (if available) or relapse on samples of indicated breast cancer subtypes from datasets not used to train the Fra-1 classifier (
SI Appendix, Methods
).
Fig. 4.
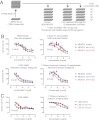
A screen for small molecules identifies adenosine receptor inhibitors as compounds preferentially targeting Fra-1–expressing breast tumor cells. (A) Screen design and protocol. (B) Dose–response curves of control and Fra-1–depleted MDA-MB-231 cell lines treated with the indicated compounds. n = 4. Error bars indicate SD. (C) Dose–response curves of control and Fra-1–depleted LM2 cell lines treated with the indicated compounds. n = 4. Error bars indicate SD. The P values shown in B and C are for the two sh-Fra-1 groups vs. control based on a repeated measures ANOVA followed by Bonferroni’s multiple comparison test. Data in B and C are representative of three independent experiments.
Fig. 5.
ADORA2B is a Fra-1 target gene contributing to metastatic activity of breast cancer cells. (A) Quantification of the luminescence signal in the lungs of mice injected i.v. with 2 × 10⁵ LM2 cells expressing a control or sh-ADORA2B vector at different time points as indicated. n = 6. Error bars indicate SE. *P < 0.05, **P < 0.01 for the two _sh_-ADORA2B groups vs. control based on a two-tailed Wilcoxon signed-rank test. (B) Migration (Left) and invasion (Right) capacities as a function of ADORA2B depletion. n = 3. Error bars indicate SD. *P < 0.002 vs. control based on a one-way ANOVA followed by a partial least-squares difference test. (C) Representative immunofluorescence imaging of filopodia in LM2 cells depleted for ADORA2B or treated with 100 μM theophylline. Control cells were treated with excipient. Merged images of DNA (blue), F-actin (red), and α-tubulin (green) staining are shown. Individual images are provided in
SI Appendix, Fig. S14_C_
. (Scale bars: 10 μm.). (D) Quantification of the luminescence signal in the lungs of mice injected i.v. with 2 × 10⁵ LM2 cells and receiving the indicated treatment (docetaxel, 4 mg/kg i.p. weekly, and/or theophylline, 10 mM in drinking water) at different time points as indicated. n = 6. Error bars indicate SE. *P < 0.05, **P < 0.005, combined treatment vs. docetaxel-only group based on a two-tailed Wilcoxon signed-rank test. Data are representative of two (A_–_C) or three (D) independent experiments.
Comment in
- Metastasis: ADORA(2B)tion.
McCarthy N. McCarthy N. Nat Rev Cancer. 2013 May;13(5):294-5. doi: 10.1038/nrc3508. Epub 2013 Mar 28. Nat Rev Cancer. 2013. PMID: 23535847 No abstract available.
Similar articles
- Systematic functional perturbations uncover a prognostic genetic network driving human breast cancer.
Gallenne T, Ross KN, Visser NL, Salony, Desmet CJ, Wittner BS, Wessels LFA, Ramaswamy S, Peeper DS. Gallenne T, et al. Oncotarget. 2017 Mar 15;8(13):20572-20587. doi: 10.18632/oncotarget.16244. Oncotarget. 2017. PMID: 28411283 Free PMC article. - MicroRNA-34 suppresses breast cancer invasion and metastasis by directly targeting Fra-1.
Yang S, Li Y, Gao J, Zhang T, Li S, Luo A, Chen H, Ding F, Wang X, Liu Z. Yang S, et al. Oncogene. 2013 Sep 5;32(36):4294-303. doi: 10.1038/onc.2012.432. Epub 2012 Sep 24. Oncogene. 2013. PMID: 23001043 - Prognostic impact of transcription factor Fra-1 in ER-positive breast cancer: contribution to a metastatic phenotype through modulation of tumor cell adhesive properties.
Oliveira-Ferrer L, Kürschner M, Labitzky V, Wicklein D, Müller V, Lüers G, Schumacher U, Milde-Langosch K, Schröder C. Oliveira-Ferrer L, et al. J Cancer Res Clin Oncol. 2015 Oct;141(10):1715-26. doi: 10.1007/s00432-015-1925-2. Epub 2015 Feb 10. J Cancer Res Clin Oncol. 2015. PMID: 25666264 - FRA-1 as a Regulator of EMT and Metastasis in Breast Cancer.
Casalino L, Talotta F, Matino I, Verde P. Casalino L, et al. Int J Mol Sci. 2023 May 5;24(9):8307. doi: 10.3390/ijms24098307. Int J Mol Sci. 2023. PMID: 37176013 Free PMC article. Review. - The nuclear oncoprotein Fra-1: a transcription factor knocking on therapeutic applications' door.
Talotta F, Casalino L, Verde P. Talotta F, et al. Oncogene. 2020 Jun;39(23):4491-4506. doi: 10.1038/s41388-020-1306-4. Epub 2020 May 8. Oncogene. 2020. PMID: 32385348 Review.
Cited by
- An In Vivo Gain-of-Function Screen Identifies the Williams-Beuren Syndrome Gene GTF2IRD1 as a Mammary Tumor Promoter.
Huo Y, Su T, Cai Q, Macara IG. Huo Y, et al. Cell Rep. 2016 Jun 7;15(10):2089-2096. doi: 10.1016/j.celrep.2016.05.011. Epub 2016 May 26. Cell Rep. 2016. PMID: 27239038 Free PMC article. - PR55α-containing protein phosphatase 2A complexes promote cancer cell migration and invasion through regulation of AP-1 transcriptional activity.
Gilan O, Diesch J, Amalia M, Jastrzebski K, Chueh AC, Verrills NM, Pearson RB, Mariadason JM, Tulchinsky E, Hannan RD, Dhillon AS. Gilan O, et al. Oncogene. 2015 Mar 5;34(10):1333-9. doi: 10.1038/onc.2014.26. Epub 2014 Mar 17. Oncogene. 2015. PMID: 24632621 - Human monocyte recognition of adenosine-based cyclic dinucleotides unveils the A2a Gαs protein-coupled receptor tonic inhibition of mitochondrially induced cell death.
Tosolini M, Pont F, Bétous D, Ravet E, Ligat L, Lopez F, Poupot M, Poirot M, Pérouzel É, Tiraby G, Verhoeyen E, Fournié JJ. Tosolini M, et al. Mol Cell Biol. 2015 Jan;35(2):479-95. doi: 10.1128/MCB.01204-14. Epub 2014 Nov 10. Mol Cell Biol. 2015. PMID: 25384972 Free PMC article. - Notch3 negatively regulates chemoresistance in breast cancers.
Gu X, Lu C, He D, Lu Y, Jin J, Liu D, Ma X. Gu X, et al. Tumour Biol. 2016 Oct 14. doi: 10.1007/s13277-016-5412-4. Online ahead of print. Tumour Biol. 2016. PMID: 27743379 - Current Understanding of the Role of Adenosine Receptors in Cancer.
Venugopala KN, Buccioni M. Venugopala KN, et al. Molecules. 2024 Jul 26;29(15):3501. doi: 10.3390/molecules29153501. Molecules. 2024. PMID: 39124905 Free PMC article. Review.
References
- Perou CM, et al. Molecular portraits of human breast tumours. Nature. 2000;406(6797):747–752. - PubMed
- van de Vijver MJ, et al. A gene-expression signature as a predictor of survival in breast cancer. N Engl J Med. 2002;347(25):1999–2009. - PubMed
- Wang Y, et al. Gene-expression profiles to predict distant metastasis of lymph-node-negative primary breast cancer. Lancet. 2005;365(9460):671–679. - PubMed
Publication types
MeSH terms
Substances
LinkOut - more resources
Full Text Sources
Other Literature Sources
Medical


