Presynaptic calcium influx controls neurotransmitter release in part by regulating the effective size of the readily releasable pool - PubMed (original) (raw)
Presynaptic calcium influx controls neurotransmitter release in part by regulating the effective size of the readily releasable pool
Monica S Thanawala et al. J Neurosci. 2013.
Abstract
The steep calcium dependence of synaptic strength that has been observed at many synapses is thought to reflect a calcium dependence of the probability of vesicular exocytosis (p), with the cooperativity of three to six corresponding to the multiple calcium ion binding sites on the calcium sensor responsible for exocytosis. Here we test the hypothesis that the calcium dependence of the effective size of the readily releasable pool (RRP) also contributes to the calcium dependence of release at the calyx of Held synapse in mice. Using two established methods of quantifying neurotransmitter release evoked by action potentials (effective RRP), we find that when calcium influx is changed by altering the external calcium concentration, the calcium cooperativity of p is insufficient to account for the full calcium dependence of EPSC size; the calcium dependence of the RRP size also contributes. Reducing calcium influx by blocking R-type voltage-gated calcium channels (VGCCs) with Ni(2+), or by blocking P/Q-type VGCCs with ω-agatoxin IVA also changes EPSC amplitude by reducing both p and the effective RRP size. This suggests that the effective RRP size is dependent on calcium influx through VGCCs. Furthermore, activation of GABAB receptors, which reduces presynaptic calcium through VGCCs without other significant effects on release, also reduces the effective RRP size in addition to reducing p. These findings indicate that calcium influx regulates the RRP size along with p, which contributes to the calcium dependence of synaptic strength, and it influences the manner in which presynaptic modulation of presynaptic calcium channels affects neurotransmitter release.
Figures
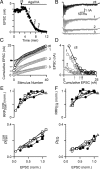
Figure 1.
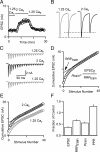
Altering presynaptic calcium influx affects synaptic transmission in part by changing effective RRP size. A, Time course of EPSC amplitude during wash-in of 2 m
m
external calcium (Cae), followed by 1.25 m
m
Cae. B, A comparison of pairs of EPSCs normalized to the amplitude of the first EPSC (EPSC0) reveals that paired-pulse plasticity varies with Cae. C, EPSCs evoked by 100 Hz trains delivered in different Cae conditions. D, Example estimation of effective RRP size (RRPtrain) by back-extrapolation of the cumulative EPSC to the _y_-axis. The probability of release (_p_train) is estimated by dividing the amplitude of the first EPSC by RRPtrain. E, A comparison of cumulative EPSCs reveals that RRPtrain is larger in 2 m
m
Cae than in 1.25 m
m
Cae. F, Summary of the effects of altered Cae (1.25 m
m
compared with 2 m
m
in control) on the properties of synaptic transmission (n = 5).
Figure 2.
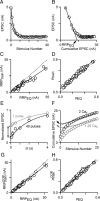
Techniques to quantify neurotransmitter release in response to a stimulus train. A, Plot of EPSC amplitude versus stimulus number for a 100 Hz train in control conditions fitted with a single-exponential curve. B, Plot of EPSC amplitude versus cumulative EPSC amplitude for the data in A. A linear fit to the steepest range of the data gives an estimate of RRP size (RRPEQ). C, Plot of RRPtrain and RRPEQ values for cells in different Cae (1, 1.25, 1.5, 2, 3, and 4 m
m
). C, D, G, H, A linear fit to the data (black line) and the unity line (dashed line) are shown. D, Plot of _p_train and _p_EQ values for the same cells as in C. E, Normalized EPSC amplitudes show recovery from depression after a single conditioning stimulus (gray circles) and after 40 stimuli at 100 Hz (black circles). Data were fit to a function of the form (A + B exp(− t/τ)), with parameters {A, B, t} of {1, −0.466 ± 4.73 × 10⁻³, 2.54 ± .098 s} following 1 conditioning stimulus and {1, −0.848 ± 0.011, 2.47 ± .146 s} following a train. F, Comparison of RRPtrain (dashed lines) and corrected RRPtrain, or RRPtrainCOR, (solid lines) methods for measuring RRP.RRPtrainCOR is indicated for 2 m
m
Cae (black arrow) and for 1.25 m
m
Cae (gray arrow). G, Plot of RRPtrainCOR versus RRPEQ and (H) corrected _p_train (_p_trainCOR) versus pEQ for cells in different Cae.
Figure 3.
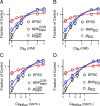
Contributions of effective RRP size to the calcium dependence of release. A, Plot of EPSC size, RRPtrainCOR, and _p_trainCOR (normalized to values in 2 m
m
Cae) versus Cae. B, Plot of EPSC, _p_EQ, and RRPEQ (normalized to values in 2 m
m
Cae) versus Cae. Plots in C and D are similar to plots in A and B, but values are plotted versus calcium influx (Cainflux). Relationship between Cae and Cainflux from Schneggenburger et al., 1999. All plots show data for 1, 1.25, 1.5, 2, 3, and 4 m
m
Cae. n ≥ 5 cells per Cae value.
Figure 4.
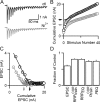
Nickel, a blocker of R-type VGCCs, reduces synaptic transmission through changes in p and effective RRP. A, Example of postsynaptic responses to 100 Hz stimulus trains in control conditions (black) and Ni2+ (gray). B, A comparison of cumulative EPSCs reveals that RRPtrainCOR is reduced upon application of nickel chloride. Black circles indicate control conditions; gray circles indicate Ni2+. Arrows indicate RRPtrainCOR. C, Plot of EPSC amplitude versus cumulative EPSC amplitude for the same data reveals that RRPEQ is also reduced in nickel chloride. Black circles indicate control conditions; gray circles indicate Ni2+. Arrows indicate RRPEQ. D, Summary of the effect of Ni2+ on the properties of synaptic transmission (n = 8).
Figure 5.
Inhibiting calcium entry through P-type VGCCs reduces synaptic strength through changes in p and effective RRP. A, Application of the selective P/Q-type calcium channel antagonist ω-agatoxin IVA (50 n
m
) potently inhibits EPSC amplitude. In this example cell, 100 Hz trains were delivered once in control conditions (black arrow) and three times during wash-in of ω-agatoxin IVA (AgaIVA, gray arrows). B, Postsynaptic responses in an example cell to a 100 Hz train in control conditions (black trace) and during submaximal application (gray traces). Times at which trains were delivered are indicated by arrows in A. C, Cumulative EPSC plots for the same example cell indicate that RRPtrainCOR is reduced by AgaIVA. Arrows indicate RRPtrainCOR. D, Plots of peak EPSC amplitude versus cumulative EPSC indicate that RRPEQ is reduced by AgaIVA. Arrows indicate RRPEQ. E, Plots of RRPtrainCOR normalized to control value (top) and _p_trainCOR (bottom) and (F) RRPEQ normalized to control value (top) and _p_EQ (bottom) (F) as a function of EPSC amplitude. Each cell has a unique marker to indicate subsequent trains.
Figure 6.
GABAB receptors modulate synaptic transmission through changes in p and effective RRP. A, Postsynaptic responses to a 100 Hz stimulus train in control conditions (black), in 100 μ
m
baclofen (bac; red), and in 20 μ
m
CGP 55845 (CGP; blue). B, Plot of cumulative EPSC versus stimulus number for example cell in control (black circles) and baclofen (red circles) indicates that RRPtrainCOR is reduced in baclofen. RRPtrainCOR is indicated by arrows. C, Plot of EPSC amplitude versus cumulative EPSC amplitude for the same data reveals that RRPEQ is also reduced in baclofen. RRPEQ is indicated by arrows. D, Summary of the effects of baclofen on properties of synaptic transmission (n = 9).
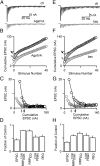
Figure 7.
The size of the effective RRP is regulated by changes in presynaptic calcium influx for 300 Hz trains at near-physiological temperature. A, Postsynaptic responses of an example cell to a 300 Hz stimulus train delivered in control conditions and in AgaIVA. B, Cumulative EPSC in an example cell in control conditions (black circles) and in AgaIVA (gray circles) for the response shown in A. The value of RRP_train_COR is reduced (black vs gray arrows). C, Plot of EPSC amplitude versus cumulative EPSC for the same example cell. Agatoxin (gray circles) reduces RRPEQ (gray vs black arrows). D, Summary of changes to EPSC amplitude, RRP_train_COR, RRPEQ, p _train_COR, and _p_EQ. (n = 4). E, Postsynaptic responses of an example cell to a 300 Hz stimulus train delivered in control conditions and in baclofen (100 μ
m
). F, Cumulative EPSC in an example cell in control conditions (black circles) and in baclofen (gray circles) for a 300 Hz train delivered at 35°C. The value of RRP_train_COR is reduced (gray vs black arrows). G, Plot of EPSC amplitude versus cumulative EPSC for the same example cell. Baclofen (gray circles) reduces RRPEQ (gray vs black arrows). H, Summary of changes to EPSC amplitude, RRPtrainCOR, RRPEQ, _p_trainCOR, and _p_EQ. (n = 5).
Figure 8.
Simulations indicate that changes in the effective RRP help to explain the effect of changing presynaptic calcium influx on postsynaptic responses. These simulations are based on a model of vesicular release (see Materials and Methods). A, Cumulative EPSCs are shown for control conditions (black), for fractional reductions in p (0.33 of control, blue), effective RRP (0.33 of control, green), and for both effective RRP and p reduced (to 0.73 and 0.46 of control, respectively, red). B, C, Cumulative EPSCs are shown for two example experiments in control conditions (gray circles) and in the presence of baclofen (light red circles) for 100 Hz trains at 25°C (B) and for 300 Hz trains at 35°C (C). The black and red lines in B and C are fits to control and baclofen cumulative EPSCs, respectively, that were determined using an iterative fitting process that had three free parameters {effective RRP, p, and the replenishment rate per empty release site}. For the other lines, parameters from the control fit were used but either p or effective RRP was reduced. The parameters of the lines for B are {9.96, 0.25, 0.025, black}, {7.64, 0.12, 0.033, red}, p is 0.33 of control (blue), and effective RRP is 0.33 of control (green), and for C {65.9, 0.24, 0.036, black}, {37.4, 0.18, 0.037, red}, p is 0.41 of control (blue), and effective RRP is 0.41 of control (green).
Similar articles
- Developmental transformation of the release modality at the calyx of Held synapse.
Fedchyshyn MJ, Wang LY. Fedchyshyn MJ, et al. J Neurosci. 2005 Apr 20;25(16):4131-40. doi: 10.1523/JNEUROSCI.0350-05.2005. J Neurosci. 2005. PMID: 15843616 Free PMC article. - Calcium microdomains near R-type calcium channels control the induction of presynaptic long-term potentiation at parallel fiber to purkinje cell synapses.
Myoga MH, Regehr WG. Myoga MH, et al. J Neurosci. 2011 Apr 6;31(14):5235-43. doi: 10.1523/JNEUROSCI.5252-10.2011. J Neurosci. 2011. PMID: 21471358 Free PMC article. - Inhibition [corrected] of olfactory receptor neuron input to olfactory bulb glomeruli mediated by suppression of presynaptic calcium influx.
Wachowiak M, McGann JP, Heyward PM, Shao Z, Puche AC, Shipley MT. Wachowiak M, et al. J Neurophysiol. 2005 Oct;94(4):2700-12. doi: 10.1152/jn.00286.2005. Epub 2005 May 25. J Neurophysiol. 2005. PMID: 15917320 Free PMC article. - How voltage-gated calcium channels gate forms of homeostatic synaptic plasticity.
Frank CA. Frank CA. Front Cell Neurosci. 2014 Feb 14;8:40. doi: 10.3389/fncel.2014.00040. eCollection 2014. Front Cell Neurosci. 2014. PMID: 24592212 Free PMC article. Review. - Presynaptic origins of distinct modes of neurotransmitter release.
Chanaday NL, Kavalali ET. Chanaday NL, et al. Curr Opin Neurobiol. 2018 Aug;51:119-126. doi: 10.1016/j.conb.2018.03.005. Epub 2018 Mar 26. Curr Opin Neurobiol. 2018. PMID: 29597140 Free PMC article. Review.
Cited by
- Sex- and subtype-specific adaptations in excitatory signaling onto deep-layer prelimbic cortical pyramidal neurons after chronic alcohol exposure.
Hughes BA, O'Buckley TK, Boero G, Herman MA, Morrow AL. Hughes BA, et al. Neuropsychopharmacology. 2021 Oct;46(11):1927-1936. doi: 10.1038/s41386-021-01034-1. Epub 2021 May 25. Neuropsychopharmacology. 2021. PMID: 34035471 Free PMC article. - Implementation of linear sensory signaling via multiple coordinated mechanisms at central vestibular nerve synapses.
McElvain LE, Faulstich M, Jeanne JM, Moore JD, du Lac S. McElvain LE, et al. Neuron. 2015 Mar 4;85(5):1132-44. doi: 10.1016/j.neuron.2015.01.017. Epub 2015 Feb 19. Neuron. 2015. PMID: 25704949 Free PMC article. - Rapid dynamic changes of dendritic inhibition in the dentate gyrus by presynaptic activity patterns.
Liu YC, Cheng JK, Lien CC. Liu YC, et al. J Neurosci. 2014 Jan 22;34(4):1344-57. doi: 10.1523/JNEUROSCI.2566-13.2014. J Neurosci. 2014. PMID: 24453325 Free PMC article. - Cav2.1 channels control multivesicular release by relying on their distance from exocytotic Ca2+ sensors at rat cerebellar granule cells.
Satake S, Imoto K. Satake S, et al. J Neurosci. 2014 Jan 22;34(4):1462-74. doi: 10.1523/JNEUROSCI.2388-13.2014. J Neurosci. 2014. PMID: 24453334 Free PMC article. - Extremely Low Frequency Electromagnetic Fields Facilitate Vesicle Endocytosis by Increasing Presynaptic Calcium Channel Expression at a Central Synapse.
Sun ZC, Ge JL, Guo B, Guo J, Hao M, Wu YC, Lin YA, La T, Yao PT, Mei YA, Feng Y, Xue L. Sun ZC, et al. Sci Rep. 2016 Feb 18;6:21774. doi: 10.1038/srep21774. Sci Rep. 2016. PMID: 26887777 Free PMC article.
References
- Augustine GJ. How does calcium trigger neurotransmitter release? Curr Opin Neurobiol. 2001;11:320–326. - PubMed
- Borst JG, Sakmann B. Calcium influx and transmitter release in a fast CNS synapse. Nature. 1996;383:431–434. - PubMed
Publication types
MeSH terms
Substances
Grants and funding
- F31 NS073252/NS/NINDS NIH HHS/United States
- R01 NS032405/NS/NINDS NIH HHS/United States
- R37 NS032405/NS/NINDS NIH HHS/United States
- T32 MH020017/MH/NIMH NIH HHS/United States
LinkOut - more resources
Full Text Sources
Other Literature Sources
