Structure, dynamics, evolution, and function of a major scaffold component in the nuclear pore complex - PubMed (original) (raw)
. 2013 Apr 2;21(4):560-71.
doi: 10.1016/j.str.2013.02.005. Epub 2013 Mar 14.
Seung Joong Kim, Paula Upla, William J Rice, Jeremy Phillips, Benjamin L Timney, Ursula Pieper, Jeffrey B Bonanno, Javier Fernandez-Martinez, Zhanna Hakhverdyan, Natalia E Ketaren, Tsutomu Matsui, Thomas M Weiss, David L Stokes, J Michael Sauder, Stephen K Burley, Andrej Sali, Michael P Rout, Steven C Almo
Affiliations
- PMID: 23499021
- PMCID: PMC3755625
- DOI: 10.1016/j.str.2013.02.005
Structure, dynamics, evolution, and function of a major scaffold component in the nuclear pore complex
Parthasarathy Sampathkumar et al. Structure. 2013.
Abstract
The nuclear pore complex, composed of proteins termed nucleoporins (Nups), is responsible for nucleocytoplasmic transport in eukaryotes. Nuclear pore complexes (NPCs) form an annular structure composed of the nuclear ring, cytoplasmic ring, a membrane ring, and two inner rings. Nup192 is a major component of the NPC's inner ring. We report the crystal structure of Saccharomyces cerevisiae Nup192 residues 2-960 [ScNup192(2-960)], which adopts an α-helical fold with three domains (i.e., D1, D2, and D3). Small angle X-ray scattering and electron microscopy (EM) studies reveal that ScNup192(2-960) could undergo long-range transition between "open" and "closed" conformations. We obtained a structural model of full-length ScNup192 based on EM, the structure of ScNup192(2-960), and homology modeling. Evolutionary analyses using the ScNup192(2-960) structure suggest that NPCs and vesicle-coating complexes are descended from a common membrane-coating ancestral complex. We show that suppression of Nup192 expression leads to compromised nuclear transport and hypothesize a role for Nup192 in modulating the permeability of the NPC central channel.
Copyright © 2013 Elsevier Ltd. All rights reserved.
Figures
Figure 1. Structure and Surface Properties of ScNup192(2–960)
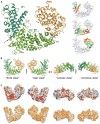
(A) Overall structure of ScNup192(2–960) is shown as a cartoon representation with the D1, D2, and D3 domains colored cyan, green, and gold, respectively. Interdomain loops comprising residues 204–211 and 663–670 are marked by arrows. Residues at the boundaries of the disordered loops are depicted as gray spheres, and the beginning of these loops are marked as L1, L2, L3, and L4. Side panels show individual D1, D2, and D3 domains as the blue to red rainbow from N to C terminus. Secondary structure elements are shown as defined by the DSSP (Kabsch and Sander, 1983) program. Strands of the β-hairpin are labeled in blue; additionally, helices are numbered consecutively with 310 helices treated as α helices for simplicity. See also Figure S1. (B) Representations of the front, rear, convex, and concave views of the ScNup192(2–960) are illustrated with the D1, D2, and D3 domains colored cyan, green, and gold, respectively. (C) The top row shows electrostatic potential of ScNup192(2–960) plotted onto its solvent accessible surface. Missing side chains and charges were assigned for ScNup192(2–960) structure using Protein Data Bank (PDB) 2PQR (Dolinsky et al., 2007), and electrostatic surface was calculated using APBS (Baker et al., 2001) within PyMOL. Negative (−7 kT/e) and positive (+7 kT/e) potentials are shown in red and blue, respectively. The bottom row shows conservation of 11 different fungal Nup192 sequences plotted onto the surface of ScNup192(2–960) structure with least to absolutely conserved residues colored as a gradient from white to orange. See also Figure S2.
Figure 2. Conformational Flexibility of ScNup192(2–960)
(A) Stereoview of the top normal mode predicted by elNémo (Suhre and Sanejouand, 2004) is shown, depicting the motion of D1 and D3 domains relative to the D2 domain of ScNup192(2–960). Residues in the hinge regions 204–211 and 663–670, between the domains, are colored in black. (B) Comparison of the merged experimental SAXS profile (black) of ScNup192(2–960) with the calculated SAXS profiles from the crystal structure (χ = 4.03, red), the “complete model” (χ = 3.84, green), and the 3:2 mixture of “open” and “closed” conformations (χ = 1.45, blue) are shown. The lower plot presents the residuals (calculated intensity/experimental intensity) of each calculated SAXS profile. The upper inset shows the SAXS profiles in the Guinier plot with an Rg fit of 39.30 ± 0.45 Å. The maximum particle size (_D_max) is 123 Å. (C) The crystal structure shown as cylinders (in red, front and top views) was fitted to the ab initio shape (represented as a gray envelope) computed from the experimental SAXS profile. This comparison reveals extra volume in solution. See also Figure S3A. (D) The “open” (in blue) and “closed” (in cyan) conformations of ScNup192(2–960) were fitted with the ab initio shape (represented as a gray envelope) computed from the experimental SAXS profile. The mixture of two conformation envelopes agrees well with the ab initio shape. See also Figure S3B and Movies S1, S2, S3, and S4. (E) Selected negative stain EM class averages are shown along with the projections of the “complete model”, “open”, and “closed” conformations. The em2D scores are shown in the bottom of each projection. See also Figure S4, showing 44 EM class averages along with projection of the “complete model”, “open”, and “closed” conformations, and Figure S5, illustrating histogram of em2D scores for selected class averages. See also Tables S1 and S2.
Figure 3. Structural Relatives of ScNup192(2–960)
(A) The heat map shown above illustrates the structural relationship of ScNup192(2–960) with selected α-helical proteins representing ten functional groups. Standardized scores for Dali, CE, and Multiprot alignments represented as a yellow to red gradient; red indicates stronger alignment scores (Table S2). The structure dendrogram is computed by hierarchical clustering using pairwise distances between alignment Z scores. The bar on the left shows the protein class for each structure, showing that karyopherins, β-catenin, and adaptin proteins are closest to Nup192. See also Figures S6B and S6C and Tables S4 and S5 for analyses on Nup85 and Nup170 structures. (B–E) Structural superpositions of Nup192(2–960) with karyopherin 60 (PDB: 1EE4, chain A), karyopherin 95 (PDB: 1IBR, chain B), β-catenin (PDB: 1QZ7, chain A), and adaptor protein 1 (PDB: 1W63, chain A), respectively, are illustrated based on DALI alignments. These were the top structural alignment hits among the karyopherin alpha, karyopherin beta, β-catenin, and adaptin protein families. The D1, D2, and D3 domains of ScNup192(2–960) structure are shown in cyan, green, and gold, respectively, and the superposed molecules are in gray. See also Figure S6A. See also Table S3.
Figure 4. Structural Model of the ScNup192FL
The EM reconstruction of ScNup192FL refined at 26 Å resolution, represented as envelope, is shown in two distinct views. The crystal structure of ScNup192(2–960) and a homology model of ScNup192 C-terminal region, residues 961–1,683, were fitted on the EM map using Chimera (Pettersen et al., 2004). The D1, D2, and D3 domains of ScNup192(2–960) are shown in cyan, green, and gold, respectively. The homology model of ScNup192 C-terminal region is shown in gray. See also Figure S7 and Table S6.
Figure 5. Steady State Localization of Transport Reporter after Depletion of Nup192
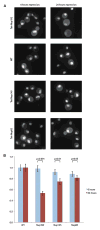
(A) The different panels show the localization of the Nab2NLS-mCherry-PrA NPC function reporter protein in strains where Nup192, Nup145, or Nup82 levels were repressed with chlortetracycline. Example images of these strains are shown after 0 or 24 hr of repression. (B) The N/C ratios of the reporter were quantified from ~100 cells per condition and normalized to a WT N/C value of 1 at the respective time point. These mean values are plotted with error bars of the standard error of the normalized means. Reported p values were the result of a Mann-Whitney rank sum test, comparing the distributions of normalized N/C values with or without repression. See also Figure S8.
Figure 6. Evolutionary Relationship between Membrane-Coating Complexes
Two possible evolutionary scenarios based on the structural relationship of ScNup192(2–960) with the karyopherin, β-catenin, and adaptin protein families are shown in (A) and (B). The α-solenoid-like and β-propeller folds are represented as rods and circles, respectively. See Discussion for the explanation.
Similar articles
- Architecture of the linker-scaffold in the nuclear pore.
Petrovic S, Samanta D, Perriches T, Bley CJ, Thierbach K, Brown B, Nie S, Mobbs GW, Stevens TA, Liu X, Tomaleri GP, Schaus L, Hoelz A. Petrovic S, et al. Science. 2022 Jun 10;376(6598):eabm9798. doi: 10.1126/science.abm9798. Epub 2022 Jun 10. Science. 2022. PMID: 35679425 Free PMC article. - Integrative structure-function mapping of the nucleoporin Nup133 suggests a conserved mechanism for membrane anchoring of the nuclear pore complex.
Kim SJ, Fernandez-Martinez J, Sampathkumar P, Martel A, Matsui T, Tsuruta H, Weiss TM, Shi Y, Markina-Inarrairaegui A, Bonanno JB, Sauder JM, Burley SK, Chait BT, Almo SC, Rout MP, Sali A. Kim SJ, et al. Mol Cell Proteomics. 2014 Nov;13(11):2911-26. doi: 10.1074/mcp.M114.040915. Epub 2014 Aug 19. Mol Cell Proteomics. 2014. PMID: 25139911 Free PMC article. - The molecular architecture of the nuclear pore complex.
Alber F, Dokudovskaya S, Veenhoff LM, Zhang W, Kipper J, Devos D, Suprapto A, Karni-Schmidt O, Williams R, Chait BT, Sali A, Rout MP. Alber F, et al. Nature. 2007 Nov 29;450(7170):695-701. doi: 10.1038/nature06405. Nature. 2007. PMID: 18046406 - Membrane-coating lattice scaffolds in the nuclear pore and vesicle coats: commonalities, differences, challenges.
Leksa NC, Schwartz TU. Leksa NC, et al. Nucleus. 2010 Jul-Aug;1(4):314-8. doi: 10.4161/nucl.1.4.11798. Epub 2010 Mar 12. Nucleus. 2010. PMID: 21327078 Free PMC article. Review. - Structure and Assembly of the Nuclear Pore Complex.
Hampoelz B, Andres-Pons A, Kastritis P, Beck M. Hampoelz B, et al. Annu Rev Biophys. 2019 May 6;48:515-536. doi: 10.1146/annurev-biophys-052118-115308. Epub 2019 Apr 3. Annu Rev Biophys. 2019. PMID: 30943044 Review.
Cited by
- Sequence evidence for common ancestry of eukaryotic endomembrane coatomers.
Promponas VJ, Katsani KR, Blencowe BJ, Ouzounis CA. Promponas VJ, et al. Sci Rep. 2016 Mar 2;6:22311. doi: 10.1038/srep22311. Sci Rep. 2016. PMID: 26931514 Free PMC article. - Importin-β modulates the permeability of the nuclear pore complex in a Ran-dependent manner.
Lowe AR, Tang JH, Yassif J, Graf M, Huang WY, Groves JT, Weis K, Liphardt JT. Lowe AR, et al. Elife. 2015 Mar 6;4:e04052. doi: 10.7554/eLife.04052. Elife. 2015. PMID: 25748139 Free PMC article. - Structure and nucleic acid binding activity of the nucleoporin Nup157.
Seo HS, Blus BJ, Jankovic NZ, Blobel G. Seo HS, et al. Proc Natl Acad Sci U S A. 2013 Oct 8;110(41):16450-5. doi: 10.1073/pnas.1316607110. Epub 2013 Sep 23. Proc Natl Acad Sci U S A. 2013. PMID: 24062435 Free PMC article. - Pore timing: the evolutionary origins of the nucleus and nuclear pore complex.
Field MC, Rout MP. Field MC, et al. F1000Res. 2019 Apr 3;8:F1000 Faculty Rev-369. doi: 10.12688/f1000research.16402.1. eCollection 2019. F1000Res. 2019. PMID: 31001417 Free PMC article. Review. - Toward understanding the structure of the vertebrate nuclear pore complex.
Beck M, Glavy JS. Beck M, et al. Nucleus. 2014 Mar-Apr;5(2):119-23. doi: 10.4161/nucl.28739. Epub 2014 Apr 3. Nucleus. 2014. PMID: 24699243 Free PMC article. Review.
References
- Akey CW. Structural plasticity of the nuclear pore complex. J Mol Biol. 1995;248:273–293. - PubMed
- Alber F, Dokudovskaya S, Veenhoff LM, Zhang W, Kipper J, Devos D, Suprapto A, Karni-Schmidt O, Williams R, Chait BT, et al. Determining the architectures of macromolecular assemblies. Nature. 2007a;450:683–694. - PubMed
- Alber F, Dokudovskaya S, Veenhoff LM, Zhang W, Kipper J, Devos D, Suprapto A, Karni-Schmidt O, Williams R, Chait BT, et al. The molecular architecture of the nuclear pore complex. Nature. 2007b;450:695–701. - PubMed
Publication types
MeSH terms
Substances
Grants and funding
- R01 GM083960/GM/NIGMS NIH HHS/United States
- P41RR001209/RR/NCRR NIH HHS/United States
- U54 GM074945/GM/NIGMS NIH HHS/United States
- P41 RR001209/RR/NCRR NIH HHS/United States
- U54 GM094662/GM/NIGMS NIH HHS/United States
- P41 GM103393/GM/NIGMS NIH HHS/United States
- C06 RR017528-01-CEM/CE/NCIPC CDC HHS/United States
- P30 EB009998/EB/NIBIB NIH HHS/United States
- U54 GM103511/GM/NIGMS NIH HHS/United States
- P41GM103393/GM/NIGMS NIH HHS/United States
- P30-EB-009998/EB/NIBIB NIH HHS/United States
- R01 GM071329/GM/NIGMS NIH HHS/United States
- R01 GM062427/GM/NIGMS NIH HHS/United States
- U01 GM098256/GM/NIGMS NIH HHS/United States
- C06 RR017528/RR/NCRR NIH HHS/United States
LinkOut - more resources
Full Text Sources
Other Literature Sources
Molecular Biology Databases


