A genome-wide analysis of populations from European Russia reveals a new pole of genetic diversity in northern Europe - PubMed (original) (raw)
doi: 10.1371/journal.pone.0058552. Epub 2013 Mar 7.
Denis V Khokhrin, Irina N Filippova, Tõnu Esko, Mari Nelis, Natalia A Bebyakova, Natalia L Bolotova, Janis Klovins, Liene Nikitina-Zake, Karola Rehnström, Samuli Ripatti, Stefan Schreiber, Andre Franke, Milan Macek, Veronika Krulišová, Jan Lubinski, Andres Metspalu, Svetlana A Limborska
Affiliations
- PMID: 23505534
- PMCID: PMC3591355
- DOI: 10.1371/journal.pone.0058552
A genome-wide analysis of populations from European Russia reveals a new pole of genetic diversity in northern Europe
Andrey V Khrunin et al. PLoS One. 2013.
Abstract
Several studies examined the fine-scale structure of human genetic variation in Europe. However, the European sets analyzed represent mainly northern, western, central, and southern Europe. Here, we report an analysis of approximately 166,000 single nucleotide polymorphisms in populations from eastern (northeastern) Europe: four Russian populations from European Russia, and three populations from the northernmost Finno-Ugric ethnicities (Veps and two contrast groups of Komi people). These were compared with several reference European samples, including Finns, Estonians, Latvians, Poles, Czechs, Germans, and Italians. The results obtained demonstrated genetic heterogeneity of populations living in the region studied. Russians from the central part of European Russia (Tver, Murom, and Kursk) exhibited similarities with populations from central-eastern Europe, and were distant from Russian sample from the northern Russia (Mezen district, Archangelsk region). Komi samples, especially Izhemski Komi, were significantly different from all other populations studied. These can be considered as a second pole of genetic diversity in northern Europe (in addition to the pole, occupied by Finns), as they had a distinct ancestry component. Russians from Mezen and the Finnic-speaking Veps were positioned between the two poles, but differed from each other in the proportions of Komi and Finnic ancestries. In general, our data provides a more complete genetic map of Europe accounting for the diversity in its most eastern (northeastern) populations.
Conflict of interest statement
Competing Interests: The authors have declared that no competing interests exist.
Figures
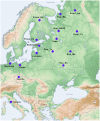
Figure 1. Geographic locations of the populations analyzed.
Key: Komi_Izh – Izhemski Komi, Komi_Pr – Priluzski Komi, Rus_Tv – Russians from Tver, Rus_Ku – Russians from Kursk, Rus_Mu – Russians from Murom, Rus_Me – Russians from Mezen, Finns_He – Finns from Helsinki, Finns_Ku – Finns from Kuusamo, Rus_HGDP – Russians from the Human Genome Diversity Panel.
Figure 2. Principal component analysis of the autosomal genotypic data of individuals from European Russia.
The first two PCs are shown. Each individual is represented by a sign and the color label corresponding to their self-identified population origin. Population designations are the same as in Figure 1.
Figure 3. Principal component analysis of the combined autosomal genotypic data of individuals from Russia and seven European countries (Finnland, Estonia, Latvia, Poland, Czech Republic, Germany and Italia [22]).
The first two PCs are shown. The color legend for the predefined population labels is indicated within the plot. Population designations are the same as in Figure 1.
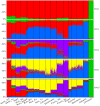
Figure 4. ADMIXTURE clustering of individuals from the populations studied.
Results obtained at K = 2 to 5 are shown. Each individual is represented by a vertical line composed of colored segments, in which each segment represents the proportion of an individual’s ancestry derived from one of the K ancestral populations. Individuals are grouped by population (labeled on the bottom of the graph). In addition to populations used in principal component analysis, a Chinese sample (Han Chinese from Beijing [22]) was included. The results at K = 5 are also accompanied by average ancestral proportions by population (*). Population designations are the same as in Figure 1.
Similar articles
- Between Lake Baikal and the Baltic Sea: genomic history of the gateway to Europe.
Triska P, Chekanov N, Stepanov V, Khusnutdinova EK, Kumar GPA, Akhmetova V, Babalyan K, Boulygina E, Kharkov V, Gubina M, Khidiyatova I, Khitrinskaya I, Khrameeva EE, Khusainova R, Konovalova N, Litvinov S, Marusin A, Mazur AM, Puzyrev V, Ivanoshchuk D, Spiridonova M, Teslyuk A, Tsygankova S, Triska M, Trofimova N, Vajda E, Balanovsky O, Baranova A, Skryabin K, Tatarinova TV, Prokhortchouk E. Triska P, et al. BMC Genet. 2017 Dec 28;18(Suppl 1):110. doi: 10.1186/s12863-017-0578-3. BMC Genet. 2017. PMID: 29297395 Free PMC article. - Regional differences in the genetic variability of Finno-Ugric speaking Komi populations.
Khrunin A, Verbenko D, Nikitina K, Limborska S. Khrunin A, et al. Am J Hum Biol. 2007 Nov-Dec;19(6):741-50. doi: 10.1002/ajhb.20620. Am J Hum Biol. 2007. PMID: 17691096 - Differentiation of mitochondrial DNA and Y chromosomes in Russian populations.
Malyarchuk B, Derenko M, Grzybowski T, Lunkina A, Czarny J, Rychkov S, Morozova I, Denisova G, Miścicka-Sliwka D. Malyarchuk B, et al. Hum Biol. 2004 Dec;76(6):877-900. doi: 10.1353/hub.2005.0021. Hum Biol. 2004. PMID: 15974299 - Complex trait susceptibilities and population diversity in a sample of 4,145 Russians.
Usoltsev D, Kolosov N, Rotar O, Loboda A, Boyarinova M, Moguchaya E, Kolesova E, Erina A, Tolkunova K, Rezapova V, Molotkov I, Melnik O, Freylikhman O, Paskar N, Alieva A, Baranova E, Bazhenova E, Beliaeva O, Vasilyeva E, Kibkalo S, Skitchenko R, Babenko A, Sergushichev A, Dushina A, Lopina E, Basyrova I, Libis R, Duplyakov D, Cherepanova N, Donner K, Laiho P, Kostareva A, Konradi A, Shlyakhto E, Palotie A, Daly MJ, Artomov M. Usoltsev D, et al. Nat Commun. 2024 Jul 23;15(1):6212. doi: 10.1038/s41467-024-50304-1. Nat Commun. 2024. PMID: 39043636 Free PMC article. - Complex interactions of the Eastern and Western Slavic populations with other European groups as revealed by mitochondrial DNA analysis.
Grzybowski T, Malyarchuk BA, Derenko MV, Perkova MA, Bednarek J, Woźniak M. Grzybowski T, et al. Forensic Sci Int Genet. 2007 Jun;1(2):141-7. doi: 10.1016/j.fsigen.2007.01.010. Epub 2007 Mar 7. Forensic Sci Int Genet. 2007. PMID: 19083745
Cited by
- Genomic landscape of the signals of positive natural selection in populations of Northern Eurasia: A view from Northern Russia.
Khrunin AV, Khvorykh GV, Fedorov AN, Limborska SA. Khrunin AV, et al. PLoS One. 2020 Feb 5;15(2):e0228778. doi: 10.1371/journal.pone.0228778. eCollection 2020. PLoS One. 2020. PMID: 32023328 Free PMC article. - Improved imputation accuracy of rare and low-frequency variants using population-specific high-coverage WGS-based imputation reference panel.
Mitt M, Kals M, Pärn K, Gabriel SB, Lander ES, Palotie A, Ripatti S, Morris AP, Metspalu A, Esko T, Mägi R, Palta P. Mitt M, et al. Eur J Hum Genet. 2017 Jun;25(7):869-876. doi: 10.1038/ejhg.2017.51. Epub 2017 Apr 12. Eur J Hum Genet. 2017. PMID: 28401899 Free PMC article. - Distribution of variants in multiple vitamin D-related loci (DHCR7/NADSYN1, GC, CYP2R1, CYP11A1, CYP24A1, VDR, RXRα and RXRγ) vary between European, East-Asian and Sub-Saharan African-ancestry populations.
Jones P, Lucock M, Chaplin G, Jablonski NG, Veysey M, Scarlett C, Beckett E. Jones P, et al. Genes Nutr. 2020 Mar 13;15(1):5. doi: 10.1186/s12263-020-00663-3. Genes Nutr. 2020. PMID: 32169032 Free PMC article. - Reconstructing genetic history of Siberian and Northeastern European populations.
Wong EH, Khrunin A, Nichols L, Pushkarev D, Khokhrin D, Verbenko D, Evgrafov O, Knowles J, Novembre J, Limborska S, Valouev A. Wong EH, et al. Genome Res. 2017 Jan;27(1):1-14. doi: 10.1101/gr.202945.115. Epub 2016 Dec 13. Genome Res. 2017. PMID: 27965293 Free PMC article. - Increasing accuracy of HLA imputation by a population-specific reference panel in a FinnGen biobank cohort.
Ritari J, Hyvärinen K, Clancy J; FinnGen; Partanen J, Koskela S. Ritari J, et al. NAR Genom Bioinform. 2020 May 6;2(2):lqaa030. doi: 10.1093/nargab/lqaa030. eCollection 2020 Jun. NAR Genom Bioinform. 2020. PMID: 33575586 Free PMC article.
References
- Li JZ, Absher DM, Tang H, Southwick AM, Casto AM, et al. (2008) Worldwide Human Relationships Inferred from Genome-Wide Patterns of Variation. Science 319: 1100–4. - PubMed
Publication types
MeSH terms
Grants and funding
This study was supported by grants from the Programs ‘Molecular and Cell Biology’ and ‘Fundamental Science for Medicine’ of the Russian Academy of Sciences; the Federal Support of Leading Scientific Schools (grant 4294.2012.4); Russian Basic Research Foundation and The Ministry of education and science of Russian Federation (project 8805). EGCUT received financing by (ENGAGE, OPENGENE), targeted financing from Estonian Government SF0180142s08, Estonian Research Roadmap through Estonian Ministry of Education and Research (3.2.0304.11-0312), Center of Excellence in Genomics (EXCEGEN) and Development Fund of University of Tartu (SP1GVARENG). MM was supported by CZ.2.16/3.1.00/24022, Institutional support for UH Motol (0064203) and by NT/13770-4 from the Czech Ministry of Health. The funders had no role in study design, data collection and analysis, decision to publish, or preparation of the manuscript.
LinkOut - more resources
Full Text Sources
Other Literature Sources


