Screening NK-, B- and T-cell phenotype and function in patients suffering from Chronic Fatigue Syndrome - PubMed (original) (raw)
doi: 10.1186/1479-5876-11-68.
Jorge Carrillo, Marta Massanella, Josepa Rigau, José Alegre, Jordi Puig, Ana M Garcia-Quintana, Jesus Castro-Marrero, Eugènia Negredo, Bonaventura Clotet, Cecilia Cabrera, Julià Blanco
Affiliations
- PMID: 23514202
- PMCID: PMC3614537
- DOI: 10.1186/1479-5876-11-68
Screening NK-, B- and T-cell phenotype and function in patients suffering from Chronic Fatigue Syndrome
Marta Curriu et al. J Transl Med. 2013.
Abstract
Background: Chronic Fatigue Syndrome (CFS) is a debilitating neuro-immune disorder of unknown etiology diagnosed by an array of clinical manifestations. Although several immunological abnormalities have been described in CFS, their heterogeneity has limited diagnostic applicability.
Methods: Immunological features of CFS were screened in 22 CFS diagnosed individuals fulfilling Fukuda criteria and 30 control healthy individuals. Peripheral blood T, B and NK cell function and phenotype were analyzed by flow cytometry in both groups.
Results: CFS diagnosed individuals showed similar absolute numbers of T, B and NK cells, with minor differences in the percentage of CD4+ and CD8+ T cells. B cells showed similar subset frequencies and proliferative responses between groups. Conversely, significant differences were observed in T cell subsets. CFS individuals showed increased levels of T regulatory cells (CD25+/FOXP3+) CD4 T cells, and lower proliferative responses in vitro and in vivo. Moreover, CD8 T cells from the CFS group showed significantly lower activation and frequency of effector memory cells. No clear signs of T-cell immunosenescence were observed. NK cells from CFS individuals displayed higher expression of NKp46 and CD69 but lower expression of CD25 in all NK subsets defined. Overall, T cell and NK cell features clearly clustered CFS individuals.
Conclusions: Our findings suggest that alterations in T-cell phenotype and proliferative response along with the specific signature of NK cell phenotype may be useful to identify CFS individuals. The striking down modulation of T cell mediated immunity may help to understand intercurrent viral infections in CFS.
Figures
Figure 1
Analysis of major lymphocyte subsets in CFS affected individuals. Fresh blood was stained with anti CD45, CD19, CD3, CD4, CD8, CD16 and CD56 antibodies. The percentage of NK (CD3–CD56+), B (CD19+) and T cells (CD3+) was analyzed in gated CD45+ lymphocytes. Similarly, after gating CD3+ lymphocytes the percentage of CD4+, CD8+ or CD56+ cells was analyzed. Figures show data from healthy donors (n = 24, HD) and SFC affected individuals (n = 17, SFC) with median values (lines), interquartile ranges (boxes) and 10–90 percentile values (bars). In all cases, _p_-values for nonparametric Mann–Whitney comparison are shown.
Figure 2
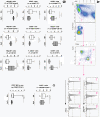
Analysis of NK cell phenotype in CFS affected individuals. Fresh blood was stained with the antibody combinations described in Table 1. Panel A. NK cells were gated as CD3-CD19- PBMC and analyzed for CD16 and CD56 staining defining CD56 bright (R1), CD56+CD16+ (R2) or CD16+ (R3) gates. Representative histograms showing the expression of NKp46 (upper plots) and CD57 (lower plots) are shown. Panel B. NK cell subsets gated according to Panel A were analyzed for the expression of CD69 (upper), CD25 (middle) and NKp46 receptor is shown. Panel C. In parallel, double positive CD56+CD16+ NK cells were analyzed for the expression of CD57, as the percentage of positive cells (upper graph) or the Mean Fluorescence intensity (lower graph). In all cases, data from healthy donors (n = 25, HD) and SFC affected individuals (n = 19, SFC) are shown, with median (thick lines), interquartile range (boxes) and 10–90 percentile values (bars). In all cases, _p_-values for nonparametric Mann–Whitney comparison are shown.
Figure 3
Analysis of CD4 and CD8 T cell subsets, immunosenescence and exhaustion. Panel A. Fresh blood was stained with the antibody combinations described in Table 1. Different CD4 and CD8 T cell subpopulations (Naïve, Central memory, Transitional memory and Effector memory) were identified by CD27, CD27 and then CCR7 and CD45RA expression as shown. Panel B. The median values for the frequency of the indicated subsets in healthy donors and CFS affected individuals are shown in circular plots. Significant differences among groups are indicated. Panel C. The entire CD4 and CD8 T cell gates were also analyzed for the expression of CD57, PD-1 and Fas-CD95. In all cases, data from healthy donors (n = 25, HD) and SFC affected individuals (n = 19, SFC) are shown, with median (thick lines), interquartile range (boxes) and 10–90 percentile values (bars). In all cases, _p_-values for nonparametric Mann–Whitney comparison are shown.
Figure 4
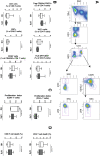
Analysis of CD4 and CD8 T cell activation, proliferative capacity and death. Panel A. Gating strategy to analyze FOXP3 and Ki67 expression. CD4 and CD8 T cells were identified in a CD3+ gate. In CD4 T cells, the expression of FOXP3 and CD25 defined the Treg population, while remaining cells were analyzed for Ki67 expression. In CD8 T cells, CD5 and Ki67 were analyzed in the whole population. Panel B. The entire CD4 and CD8 T cell gates illustrated in Figure 3 were analyzed for the frequency of Treg (CD25+FOX–P3+) cells, or for the expression of the indicated markers. In all cases, data from healthy donors (n = 25, HD) and SFC affected individuals (n = 19, SFC) are shown. Panel C. PBMC from healthy donors (n = 5, HD) and CFS affected individuals (n = 8, CFS) were stained with CFSE and cultured in the presence of a combination of PHA and IL-2 (PHA/IL-2). Data shown are proliferation index of gated CD4 or CD8 T cells calculated from best-fit curves using FlowJo software. Panel D. PBMC from healthy donors (n = 30, HD) and CFS affected individuals (n = 19, CFS) were also cultured for 24 h to assess spontaneous CD4 or CD8 T-cell death using DIOC6 and PI staining. Results show total cell death defined by low DIOC6 fluorescence signal. In all panels, median values (thick lines), interquartile ranges (boxes) and 10–90 percentile values (bars). In all cases, _p_-values for nonparametric Mann–Whitney comparison are shown.
Figure 5
Clustering CFS individuals according to NK and T cell phenotypic markers. A subset of 19 CFS (red labels) and 25 control individuals (green labels) was analyzed. Figure shows normalized centered data in yellow (for positive values, above median) and blue (for negative values, below median). Two groups of CFS and Control individuals were clearly differentiated, while a heterogeneous subgroup was clustered with CFS individuals.
Similar articles
- Association of T and NK Cell Phenotype With the Diagnosis of Myalgic Encephalomyelitis/Chronic Fatigue Syndrome (ME/CFS).
Rivas JL, Palencia T, Fernández G, García M. Rivas JL, et al. Front Immunol. 2018 May 9;9:1028. doi: 10.3389/fimmu.2018.01028. eCollection 2018. Front Immunol. 2018. PMID: 29867995 Free PMC article. - Immunological abnormalities in patients with chronic fatigue syndrome.
Tirelli U, Marotta G, Improta S, Pinto A. Tirelli U, et al. Scand J Immunol. 1994 Dec;40(6):601-8. doi: 10.1111/j.1365-3083.1994.tb03511.x. Scand J Immunol. 1994. PMID: 7997849 - [Chronic fatigue immune dysfunction syndrome].
Uchida A. Uchida A. Nihon Rinsho. 1992 Nov;50(11):2625-9. Nihon Rinsho. 1992. PMID: 1287238 Review. Japanese. - Immunological aspects of chronic fatigue syndrome.
Lorusso L, Mikhaylova SV, Capelli E, Ferrari D, Ngonga GK, Ricevuti G. Lorusso L, et al. Autoimmun Rev. 2009 Feb;8(4):287-91. doi: 10.1016/j.autrev.2008.08.003. Epub 2008 Sep 16. Autoimmun Rev. 2009. PMID: 18801465 Review.
Cited by
- Immune exhaustion in ME/CFS and long COVID.
Eaton-Fitch N, Rudd P, Er T, Hool L, Herrero L, Marshall-Gradisnik S. Eaton-Fitch N, et al. JCI Insight. 2024 Oct 22;9(20):e183810. doi: 10.1172/jci.insight.183810. JCI Insight. 2024. PMID: 39435656 Free PMC article. - Longitudinal associations of lymphocyte subsets with clinical outcomes in chronic fatigue syndrome.
Mehalick ML, Schmaling KB, Sabath DE, Buchwald DS. Mehalick ML, et al. Fatigue. 2018;6(2):80-91. doi: 10.1080/21641846.2018.1426371. Epub 2018 Jan 12. Fatigue. 2018. PMID: 30112249 Free PMC article. - Cytokine profiling of extracellular vesicles isolated from plasma in myalgic encephalomyelitis/chronic fatigue syndrome: a pilot study.
Giloteaux L, O'Neal A, Castro-Marrero J, Levine SM, Hanson MR. Giloteaux L, et al. J Transl Med. 2020 Oct 12;18(1):387. doi: 10.1186/s12967-020-02560-0. J Transl Med. 2020. PMID: 33046133 Free PMC article. - Myalgic Encephalomyelitis/Chronic Fatigue Syndrome as a Hyper-Regulated Immune System Driven by an Interplay Between Regulatory T Cells and Chronic Human Herpesvirus Infections.
Sepúlveda N, Carneiro J, Lacerda E, Nacul L. Sepúlveda N, et al. Front Immunol. 2019 Nov 21;10:2684. doi: 10.3389/fimmu.2019.02684. eCollection 2019. Front Immunol. 2019. PMID: 31824487 Free PMC article. - Rituximab impedes natural killer cell function in Chronic Fatigue Syndrome/Myalgic Encephalomyelitis patients: A pilot in vitro investigation.
Eaton N, Cabanas H, Balinas C, Klein A, Staines D, Marshall-Gradisnik S. Eaton N, et al. BMC Pharmacol Toxicol. 2018 Mar 27;19(1):12. doi: 10.1186/s40360-018-0203-8. BMC Pharmacol Toxicol. 2018. PMID: 29587879 Free PMC article.
References
- Fukuda K, Straus SE, Hickie I, Sharpe MC, Dobbins JG, Komaroff A. The chronic fatigue syndrome: a comprehensive approach to its definition and study. International Chronic Fatigue Syndrome Study Group. Ann Intern Med. 1994;121:953–959. - PubMed
Publication types
MeSH terms
Substances
LinkOut - more resources
Full Text Sources
Other Literature Sources
Medical
Research Materials


