Liver-resident NK cells confer adaptive immunity in skin-contact inflammation - PubMed (original) (raw)
. 2013 Apr;123(4):1444-56.
doi: 10.1172/JCI66381. Epub 2013 Mar 25.
Affiliations
- PMID: 23524967
- PMCID: PMC3613925
- DOI: 10.1172/JCI66381
Liver-resident NK cells confer adaptive immunity in skin-contact inflammation
Hui Peng et al. J Clin Invest. 2013 Apr.
Abstract
Liver natural killer (NK) cells were recently reported to possess memory-like properties in contact hypersensitivity (CHS) models. However, the phenotype and origin of these "memory" NK cells cannot be distinguished from other NK cell subpopulations. Here, we define the transcriptional, phenotypic, and functional features of liver NK cell subsets and their roles in mediating CHS. Liver NK cells can be divided into two distinct subsets: CD49a+DX5- and CD49a-DX5+. Substantial transcriptional and phenotypic differences existed between liver CD49a+DX5- NK cells and other NK cell subsets. CD49a+DX5- NK cells possessed memory potential and conferred hapten-specific CHS responses upon hapten challenge. Importantly, CD49a+DX5- NK cells were liver resident and were present in the liver sinusoidal blood, but not the afferent and efferent blood of the liver. Moreover, they appeared to originate from hepatic hematopoietic progenitor/stem cells (HPCs/HSCs) but not from the bone marrow, and maintained their phenotypes in the steady state. Our findings of liver-resident NK cells shed new light on the acquisition of memory-like properties of NK cells.
Figures
Figure 1. Hepatic DX5– NK cells confer memory responses in CHS.
(A) Expression of DX5 versus NK1.1 was analyzed on CD122+CD3–CD19– cells from liver, spleen, peripheral blood, BM, and iLNs of WT B6 mice. Representative FACS plots are shown. (B) The percentages of DX5– NK cells among NK (CD122+NK1.1+CD3–CD19–) cells in different organs are shown (n = 7). (C) Ear swelling in naive B6 mice that received 8 × 104 DX5+ (n = 6) or DX5– (n = 4) NK (NK1.1+ CD3– CD19–) cells from OXA-sensitized _Rag1_–/– donor liver. Recipients were challenged 1 month later with OXA on 1 ear and solvent on the other. (D) Ear swelling in naive B6 mice that received 8 × 10⁴ hepatic NK cell subsets (n = 3 per group) or splenic NK cells (n = 6) from OXA-sensitized WT mice and were challenged 1 month later. (C and D) Data are from 1 experiment representative of at least 2 independent experiments. **P < 0.01; ***P < 0.001. Unpaired Student’s t test (C) or ANOVA (D). Means ± SEM are shown in B–D.
Figure 2. Hepatic NK cells with memory capacity remain DX5– during hapten sensitization.
(A) DX5– or DX5+ NK (NK1.1+CD3–CD19–) cells (105) from naive GFP transgenic mice were adoptively transferred into lethally irradiated recipients, which were sensitized with 5% OXA on days 1 and 2. On day 5, liver MNCs from recipients or control irradiated mice that did not receive any cells were adoptively transferred into secondary recipients that were challenged 1 month later. (B) DX5 expression on GFP+ NK cells in the irradiated recipients that received GFP+DX5– (top panel) or GFP+DX5+ (bottom panel) NK cells was analyzed on day 5 before transfer. (C) Ear swelling of secondary recipients described in A was measured after OXA challenge (n = 5 per group). ***P < 0.001, ANOVA. Means ± SEM are shown. Hepatocytes (D) or F4/80+ Kupffer cells (E) in the liver of sensitized (blue) or control (gray shaded) WT mice were respectively isolated by a 2-step collagenase perfusion method, then gated and analyzed for FITC expression; the statistical results show FITC MFI on sensitized (n = 6) or control (n = 2) hepatocytes. *P < 0.05, unpaired Student’s t test. Means ± SEM are shown. (F) FITC+ cells in _Rag1_–/– mice 24 hours after sensitization of FITC on 2 consecutive days. _Rag1_–/– mice without sensitization were set as controls. FITC+ cells among liver MNCs from sensitized mice were analyzed for the expression of indicated markers. (B–F) Data are representative of 2 or 3 independent experiments. SSC, side scatter.
Figure 3. Hepatic DX5– NK cells preferentially traffic to the liver and maintain their phenotypic features after adoptive transfer.
(A) Liver MNCs (106) from CD45.1+ mice were adoptively transferred intravenously into sublethally irradiated (IR) CD45.2+ B6 mice. Twenty-four hours after transfer, CD45.1+ NK (NK1.1+CD3–CD19–) cells were analyzed for DX5 expression in recipient liver, spleen, and BM. (B) DX5– or DX5+ liver NK cells (105) were sorted from CD45.1+ mice and intravenously transferred into sublethally irradiated CD45.2+ B6 mice. DX5 expression of donor NK cells before transfer is shown pre- and post-sort. Seven days after transfer, CD45.1+ NK cells were analyzed for DX5 expression in recipient liver and spleen. All data in this figure are representative of 2 independent experiments.
Figure 4. Hepatic DX5– NK cells are distinct from other NK cell populations.
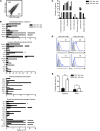
(A) Comparative transcriptome analysis between DX5– and DX5+ liver NK (NK1.1+CD3–) cells was performed by Affymetrix GeneChip Mouse Genome 430 2.0 arrays. Genes that were expressed greater than or equal to 2-fold higher or lower than DX5+ NK cells are highlighted in black. The number of genes upregulated or downregulated for each comparison is indicated. (B) Differentially expressed genes in DX5– and DX5+ NK cells were selected and classified into different groups. The listed genes had greater than or equal to 2-fold differences and are shown with their signal values. (C) Distribution by functional category of upregulated genes in hepatic DX5+ and DX5– NK cell subsets. Genes with greater than or equal to 2-fold differences were included. (D) Expression of CD107a and IFN-γ is shown for stimulated DX5– and DX5+ liver NK (NK1.1+CD3–CD19–) cells. Liver MNCs were stimulated with IL-2 and IL-12 (for IFN-γ analysis) or with YAC-1 cells (for CD107a analysis). Blue lines represent staining of the indicated molecules, and gray-shaded curves represent isotype controls. (E) Statistical results of percentages of CD107a+ (n = 6) or IFN-γ+ (n = 11) cells are shown. *P < 0.05 and **P < 0.01, paired Student’s t test. Means ± SEM are shown.
Figure 5. CD49a is a specific surface marker of liver-resident DX5– NK cells.
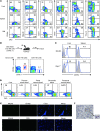
(A) Expression of CD49a, NKp46, CD51, CD27, CXCR6, and Thy1.2 versus DX5 was analyzed on NK1.1+CD3–CD19– cells or NK1.1+CD3– cells from the indicated organs of WT or CXCR6+/– (for CXCR6 detection) mice. Data are representative of 4 to 6 individual mice. (B) DX5– or DX5+ liver NK (NK1.1+ CD3– CD19–) cells (105) were sorted from CD45.1+ mice and intravenously transferred into sublethally irradiated CD45.2+ B6 mice. Seven days later, NK cells from recipient liver were analyzed for the expression of CD45.1 and CD49a. Data are representative of 2 independent experiments. (C) Expression of CD49a was analyzed on NK cells from unmanipulated BALB/c and _Rag1_–/– mice. Numbers indicate the percentages of cells expressing CD49a among NKp46+CD3–CD19– (BALB/c) or NK1.1+ (_Rag1_–/–) cells. Blue lines represent staining of the indicated molecules, and gray-shaded curves represent isotype controls. Data are representative of 4 mice per group. (D) As described in Methods, blood was collected from the unfractionated liver and other indicated sites from WT B6 mice, and then MNCs were isolated. Expression of CD49a versus DX5 was analyzed on NK1.1+CD3–CD19– cells. Plots are representative of at least 5 individual mice. (E) Immunofluorescence histology of frozen sections of mouse liver stained with anti-NKp46 (green), anti-CD31 (blue), anti-CD49a (red), or anti-CD49b (DX5; red). Original magnification, ×250. (F) Histological analysis of _Rag1_–/– mouse liver stained with anti-CD49a (brown) and NK1.1 (purple). Original magnification, ×320. (E and F) Data are representative of at least 2 independent experiments.
Figure 6. Minimal exchange of liver CD49a+DX5– NK cells in parabiotic mice.
WT B6 (CD45.2) mice were parabiosed to congenic B6-CD45.1 mice. At day 14 postsurgery, the spleen and liver were harvested and flow cytometry was performed. (A) Representative dot plot of the liver and spleen gated on live CD3–NK1.1+ cells followed by a CD45.1 gate (left panels) and CD45.2 gate (right panels) for each parabiont as indicated. The percentages of CD49a+DX5– and CD49a–DX5+ cells are shown in the dot plots. (B) The percentages of CD49a+DX5– and CD49a–DX5+ cells in the liver and spleen from A are depicted in the stacked bar graph which represents 7 parabiotic pairs. The CD49a+DX5– NK cells are indicated by the solid shading, and the CD49a–DX5+ NK cells are indicated by the open box, with each column representing the indicated parabiont, according to the CD45.1+ or CD45.2+ gate.
Figure 7. CD49a+ NK cells have the capacity to confer hapten-specific CHS responses.
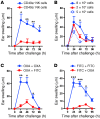
(A) Naive B6 mice received 8 × 10⁴ CD49a+ or CD49a– liver NK cells from OXA-sensitized WT mice and were challenged 1 month later (n = 4 per group). (B) Naive B6 mice received the indicated number of CD49a+ liver NK cells from OXA-sensitized WT mice and were challenged 1 month later (n = 3 per group). (C and D) Naive B6 mice received 8 × 10⁴ CD49a+ or CD49a– liver NK cells from OXA–-sensitized (C), or FITC–-sensitized (D) WT mice and were challenged with OXA or FITC 1 month later as indicated (n = 4 for the FITC plus OXA group; n = 5 for the other groups). All data are from 1 experiment representative of 2 independent experiments. *P < 0.05, **P < 0.01, and ***P < 0.001, unpaired Student’s t test (A, C, and D), or ANOVA (B). Means ± SEM of ear swelling are shown in all panels.
Figure 8. The liver retains HPCs capable of generating CD49a+DX5– NK cells.
(A) Lethally irradiated CD45.2+ B6 mice that received 2 × 10⁶ BM cells from CD45.1+ B6 mice were analyzed for the expression of DX5 on hepatic CD45.1+ NK (NK1.1+CD3–CD19–) cells. Means ± SEM are shown (n = 3 for each time point). (B) Survival of lethally irradiated B6 mice that received 3 × 10⁶ BM cells (BMT), liver MNCs (LT), or splenocytes (ST). Lethally irradiated mice without transplantation were set as the control group. Means ± SEM are shown (n = 5 per group). (C and D) Lethally irradiated CD45.2+ B6 mice received 106 CD45.1+CD45.2+ (DP) BM cells mixed with 106 CD45.1+CD45.2– (SP) liver MNCs. One month after transfer, DP and SP cells in the recipient livers were respectively gated to analyze the expression of DX5 on NK cells. Means ± SEM are shown (n = 3 per group). (E) BM cells (2 × 10⁶) from Nfil3–/– mice mixed with 105 hepatic NK1.1–CD3–CD19– cells from CD45.1+ B6 mice were transferred into lethally irradiated CD45.2+ B6 mice. One month after transfer, CD45.1+ NK cells in the recipient livers were analyzed for the expression of DX5 and CD49a. All data are representative of 2 independent experiments.
Similar articles
- The aryl hydrocarbon receptor is required for the maintenance of liver-resident natural killer cells.
Zhang LH, Shin JH, Haggadone MD, Sunwoo JB. Zhang LH, et al. J Exp Med. 2016 Oct 17;213(11):2249-2257. doi: 10.1084/jem.20151998. Epub 2016 Sep 26. J Exp Med. 2016. PMID: 27670593 Free PMC article. - Langerhans Cells Suppress CD49a+ NK Cell-Mediated Skin Inflammation.
Scholz F, Naik S, Sutterwala FS, Kaplan DH. Scholz F, et al. J Immunol. 2015 Sep 1;195(5):2335-42. doi: 10.4049/jimmunol.1500935. Epub 2015 Jul 24. J Immunol. 2015. PMID: 26209621 Free PMC article. - A discrete subset of epigenetically primed human NK cells mediates antigen-specific immune responses.
Stary V, Pandey RV, Strobl J, Kleissl L, Starlinger P, Pereyra D, Weninger W, Fischer GF, Bock C, Farlik M, Stary G. Stary V, et al. Sci Immunol. 2020 Oct 16;5(52):eaba6232. doi: 10.1126/sciimmunol.aba6232. Sci Immunol. 2020. PMID: 33067380 Free PMC article. - Tissue-resident natural killer cells in the livers.
Peng H, Tian Z. Peng H, et al. Sci China Life Sci. 2016 Dec;59(12):1218-1223. doi: 10.1007/s11427-016-0334-2. Epub 2016 Nov 30. Sci China Life Sci. 2016. PMID: 27909848 Review. - Natural Killer Cell Memory.
O'Sullivan TE, Sun JC, Lanier LL. O'Sullivan TE, et al. Immunity. 2015 Oct 20;43(4):634-45. doi: 10.1016/j.immuni.2015.09.013. Immunity. 2015. PMID: 26488815 Free PMC article. Review.
Cited by
- Recent Advances in the Role of Natural Killer Cells in Acute Kidney Injury.
Cantoni C, Granata S, Bruschi M, Spaggiari GM, Candiano G, Zaza G. Cantoni C, et al. Front Immunol. 2020 Aug 4;11:1484. doi: 10.3389/fimmu.2020.01484. eCollection 2020. Front Immunol. 2020. PMID: 32903887 Free PMC article. Review. - Key features and homing properties of NK cells in the liver are shaped by activated iNKT cells.
Trittel S, Chambers BJ, Heise U, Guzmán CA, Riese P. Trittel S, et al. Sci Rep. 2019 Nov 8;9(1):16362. doi: 10.1038/s41598-019-52666-9. Sci Rep. 2019. PMID: 31704965 Free PMC article. - Key Activating and Inhibitory Ligands Involved in the Mobilization of Natural Killer Cells for Cancer Immunotherapies.
Karmakar S, Pal P, Lal G. Karmakar S, et al. Immunotargets Ther. 2021 Nov 1;10:387-407. doi: 10.2147/ITT.S306109. eCollection 2021. Immunotargets Ther. 2021. PMID: 34754837 Free PMC article. Review. - A functional DC cross talk promotes human ILC homeostasis in humanized mice.
Lopez-Lastra S, Masse-Ranson G, Fiquet O, Darche S, Serafini N, Li Y, Dusséaux M, Strick-Marchand H, Di Santo JP. Lopez-Lastra S, et al. Blood Adv. 2017 Apr 6;1(10):601-614. doi: 10.1182/bloodadvances.2017004358. eCollection 2017 Apr 11. Blood Adv. 2017. PMID: 29296702 Free PMC article. - Plasticity of innate lymphoid cell subsets.
Bal SM, Golebski K, Spits H. Bal SM, et al. Nat Rev Immunol. 2020 Sep;20(9):552-565. doi: 10.1038/s41577-020-0282-9. Epub 2020 Feb 27. Nat Rev Immunol. 2020. PMID: 32107466 Review.
References
- Seaman WE, Blackman MA, Gindhart TD, Roubinian JR, Loeb JM, Talal N. beta-Estradiol reduces natural killer cells in mice. J Immunol. 1978;121(6):2193–2198. - PubMed
- Kumar V, Ben-Ezra J, Bennett M, Sonnenfeld G. Natural killer cells in mice treated with 89strontium: normal target-binding cell numbers but inability to kill even after interferon administration. J Immunol. 1979;123(4):1832–1838. - PubMed
Publication types
MeSH terms
Substances
Grants and funding
- R01-AI033903/AI/NIAID NIH HHS/United States
- R01 AI033903/AI/NIAID NIH HHS/United States
- T32CA009547/CA/NCI NIH HHS/United States
- HHMI/Howard Hughes Medical Institute/United States
- T32 CA009547/CA/NCI NIH HHS/United States
- R01 AI106561/AI/NIAID NIH HHS/United States
LinkOut - more resources
Full Text Sources
Other Literature Sources
Molecular Biology Databases


