Cancer genome landscapes - PubMed (original) (raw)
Review
Cancer genome landscapes
Bert Vogelstein et al. Science. 2013.
Abstract
Over the past decade, comprehensive sequencing efforts have revealed the genomic landscapes of common forms of human cancer. For most cancer types, this landscape consists of a small number of "mountains" (genes altered in a high percentage of tumors) and a much larger number of "hills" (genes altered infrequently). To date, these studies have revealed ~140 genes that, when altered by intragenic mutations, can promote or "drive" tumorigenesis. A typical tumor contains two to eight of these "driver gene" mutations; the remaining mutations are passengers that confer no selective growth advantage. Driver genes can be classified into 12 signaling pathways that regulate three core cellular processes: cell fate, cell survival, and genome maintenance. A better understanding of these pathways is one of the most pressing needs in basic cancer research. Even now, however, our knowledge of cancer genomes is sufficient to guide the development of more effective approaches for reducing cancer morbidity and mortality.
Figures
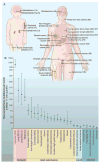
Fig. 1. Number of somatic mutations in representative human cancers, detected by genome-wide sequencing studies
(A) The genomes of a diverse group of adult (right) and pediatric (left) cancers have been analyzed. Numbers in parentheses indicate the median number of nonsynonymous mutations per tumor. (B) The median number of nonsynonymous mutations per tumor in a variety of tumor types. Horizontal bars indicate the 25 and 75% quartiles. MSI, microsatellite instability; SCLC, small cell lung cancers; NSCLC, non–small cell lung cancers; ESCC, esophageal squamous cell carcinomas; MSS, microsatellite stable; EAC, esophageal adenocarcinomas. The published data on which this figure is based are provided in table S1C.
Fig. 2. Genetic alterations and the progression of colorectal cancer
The major signaling pathways that drive tumorigenesis are shown at the transitions between each tumor stage. One of several driver genes that encode components of these pathways can be altered in any individual tumor. Patient age indicates the time intervals during which the driver genes are usually mutated. Note that this model may not apply to all tumor types. TGF-β, transforming growth factor–β.
Fig. 3. Total alterations affecting protein-coding genes in selected tumors
Average number and types of genomic alterations per tumor, including single-base substitutions (SBS), small insertions and deletions (indels), amplifications, and homozygous deletions, as determined by genome-wide sequencing studies. For colorectal, breast, and pancreatic ductal cancer, and medulloblastomas, translocations are also included. The published data on which this figure is based are provided in table S1D.
Fig. 4. Distribution of mutations in two oncogenes (PIK3CA and IDH1) and two tumor suppressor genes (RB1 and VHL)
The distribution of missense mutations (red arrowheads) and truncating mutations (blue arrowheads) in representative oncogenes and tumor suppressor genes are shown. The data were collected from genome-wide studies annotated in the COSMIC database (release version 61). For PIK3CA and IDH1, mutations obtained from the COSMIC database were randomized by the Excel RAND function, and the first 50 are shown. For RB1 and VHL, all mutations recorded in COSMIC are plotted. aa, amino acids.
Fig. 5. Number and distribution of driver gene mutations in five tumor types
The total number of driver gene mutations [in oncogenes and tumor suppressor genes (TSGs)] is shown, as well as the number of oncogene mutations alone. The driver genes are listed in tables S2A and S2B. Translocations are not included in this figure, because few studies report translocations along with the other types of genetic alterations on a per-case basis. In the tumor types shown here, translocations affecting driver genes occur in less than 10% of samples. The published data on which this figure is based are provided in table S1E.
Fig. 6. Four types of genetic heterogeneity in tumors, illustrated by a primary tumor in the pancreas and its metastatic lesions in the liver
Mutations introduced during primary tumor cell growth result in clonal heterogeneity. At the top left, a typical tumor is represented by cells with a large fraction of the total mutations (founder cells) from which subclones are derived. The differently colored regions in the subclones represent stages of evolution within a subclone. (A) Intratumoral: heterogeneity among the cells of the primary tumor. (B) Intermetastatic: heterogeneity among different metastatic lesions in the same patient. In the case illustrated here, each metastasis was derived from a different subclone. (C) Intrametastatic: heterogeneity among the cells of each metastasis develops as the metastases grow. (D) Interpatient: heterogeneity among the tumors of different patients. The mutations in the founder cells of the tumors of these two patients are almost completely distinct (see text).
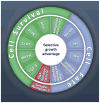
Fig. 7. Cancer cell signaling pathways and the cellular processes they regulate
All of the driver genes listed in table S2 can be classified into one or more of 12 pathways (middle ring) that confer a selective growth advantage (inner circle; see main text). These pathways can themselves be further organized into three core cellular processes (outer ring). The publications on which this figure is based are provided in table S5.
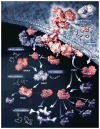
Fig. 8. Signal transduction pathways affected by mutations in human cancer
Two representative pathways from Fig. 7 (RAS and PI3K) are illustrated. The signal transducers are color coded: red indicates protein components encoded by the driver genes listed in table S2; yellow balls denote sites of phosphorylation. Examples of therapeutic agents that target some of the signal transducers are shown. RTK, receptor tyrosine kinase; GDP, guanosine diphosphate; MEK, MAPK kinase; ERK, extracellular signal–regulated kinase; NFkB, nuclear factor κB; mTOR, mammalian target of rapamycin.
Similar articles
- Our changing view of the genomic landscape of cancer.
Bell DW. Bell DW. J Pathol. 2010 Jan;220(2):231-43. doi: 10.1002/path.2645. J Pathol. 2010. PMID: 19918804 Free PMC article. Review. - Focus issue: From genomic mutations to oncogenic pathways.
Gough NR. Gough NR. Sci Signal. 2013 Mar 26;6(268):eg3. doi: 10.1126/scisignal.2004149. Sci Signal. 2013. PMID: 23532330 - Molecular pathways in tumor progression: from discovery to functional understanding.
Ali MA, Sjöblom T. Ali MA, et al. Mol Biosyst. 2009 Sep;5(9):902-8. doi: 10.1039/b903502h. Epub 2009 Jul 14. Mol Biosyst. 2009. PMID: 19668850 Review. - Looking beyond drivers and passengers in cancer genome sequencing data.
De S, Ganesan S. De S, et al. Ann Oncol. 2017 May 1;28(5):938-945. doi: 10.1093/annonc/mdw677. Ann Oncol. 2017. PMID: 27998972 Review. - From human genome to cancer genome: the first decade.
Wheeler DA, Wang L. Wheeler DA, et al. Genome Res. 2013 Jul;23(7):1054-62. doi: 10.1101/gr.157602.113. Genome Res. 2013. PMID: 23817046 Free PMC article. Review.
Cited by
- Integrated molecular and functional characterization of the intrinsic apoptotic machinery identifies therapeutic vulnerabilities in glioma.
Fernandez EG, Mai WX, Song K, Bayley NA, Kim J, Zhu H, Pioso M, Young P, Andrasz CL, Cadet D, Liau LM, Li G, Yong WH, Rodriguez FJ, Dixon SJ, Souers AJ, Li JJ, Graeber TG, Cloughesy TF, Nathanson DA. Fernandez EG, et al. Nat Commun. 2024 Nov 21;15(1):10089. doi: 10.1038/s41467-024-54138-9. Nat Commun. 2024. PMID: 39572533 Free PMC article. - DNMT3AR882H Is Not Required for Disease Maintenance in Primary Human AML, but Is Associated With Increased Leukemia Stem Cell Frequency.
Köhnke T, Karigane D, Hilgart E, Fan AC, Kayamori K, Miyauchi M, Collins CT, Suchy FP, Rangavajhula A, Feng Y, Nakauchi Y, Martinez-Montes E, Fowler JL, Loh KM, Nakauchi H, Koldobskiy MA, Feinberg AP, Majeti R. Köhnke T, et al. bioRxiv [Preprint]. 2024 Oct 29:2024.10.26.620318. doi: 10.1101/2024.10.26.620318. bioRxiv. 2024. PMID: 39553934 Free PMC article. Preprint. - Therapeutic advances in the targeting of ROR1 in hematological cancers.
Tigu AB, Munteanu R, Moldovan C, Rares D, Kegyes D, Tomai R, Moisoiu V, Ghiaur G, Tomuleasa C, Einsele H, Gulei D, Croce CM. Tigu AB, et al. Cell Death Discov. 2024 Nov 17;10(1):471. doi: 10.1038/s41420-024-02239-1. Cell Death Discov. 2024. PMID: 39551787 Free PMC article. Review. - Whole-exome sequencing reveals novel genomic signatures and potential therapeutic targets during the progression of rectal neuroendocrine neoplasm.
Xu S, Zhai ZY, Zhou P, Xue XF, Huang ZY, Li XX, Yang GH, Bao CJ, You LJ, Cui XB, Xia GL, Ou Yang MP, Li LF, Lu L, Gong W, Pei XJ, Hu W. Xu S, et al. Cell Death Dis. 2024 Nov 15;15(11):833. doi: 10.1038/s41419-024-07232-1. Cell Death Dis. 2024. PMID: 39548061 Free PMC article. - How Have Massively Parallel Sequencing Technologies Furthered Our Understanding of Oncogenesis and Cancer Progression?
Onuselogu DA, Benz S, Mitra S. Onuselogu DA, et al. Methods Mol Biol. 2025;2866:265-286. doi: 10.1007/978-1-0716-4192-7_15. Methods Mol Biol. 2025. PMID: 39546208 Review.
References
- Wood LD, et al. Science. 2007;318:1108. - PubMed
- Gryfe R, Gallinger S. Surgery. 2001;130:17. - PubMed
Publication types
MeSH terms
Grants and funding
- R37 CA043460/CA/NCI NIH HHS/United States
- P50 CA062924/CA/NCI NIH HHS/United States
- CA 121113/CA/NCI NIH HHS/United States
- HHMI/Howard Hughes Medical Institute/United States
- R01 CA121113/CA/NCI NIH HHS/United States
- CA 43460/CA/NCI NIH HHS/United States
- CA 62924/CA/NCI NIH HHS/United States
- R37 CA057345/CA/NCI NIH HHS/United States
- R01 CA057345/CA/NCI NIH HHS/United States
- CA 47345/CA/NCI NIH HHS/United States
LinkOut - more resources
Full Text Sources
Other Literature Sources
Molecular Biology Databases
Miscellaneous


