Norepinephrine modulates the motility of resting and activated microglia via different adrenergic receptors - PubMed (original) (raw)
Norepinephrine modulates the motility of resting and activated microglia via different adrenergic receptors
Stefka Gyoneva et al. J Biol Chem. 2013.
Abstract
Microglia, the resident immune cells of the central nervous system (CNS), monitor the brain for disturbances of tissue homeostasis by constantly moving their fine processes. Microglia respond to tissue damage through activation of ATP/ADP receptors followed by directional process extension to the damaged area. A common feature of several neurodegenerative diseases is the loss of norepinephrine, which might contribute to the associated neuroinflammation. We carried out a high resolution analysis of the effects of norepinephrine (NE) on microglial process dynamics in acute brain slices from mice that exhibit microglia-specific enhanced green fluorescent protein expression. Bath application of NE to the slices resulted in significant process retraction in microglia. Analysis of adrenergic receptor expression with quantitative PCR indicated that resting microglia primarily express β2 receptors but switch expression to α2A receptors under proinflammatory conditions modeled by LPS treatment. Despite the differential receptor expression, NE caused process retraction in both resting and LPS-activated microglia cultured in the gelatinous substrate Matrigel in vitro. The use of subtype-selective receptor agonists and antagonists confirmed the involvement of β2 receptors in mediating microglial process dynamics in resting cells and α2A receptors in activated cells. Co-application of NE with ATP to resting microglia blocked the ATP-induced process extension and migration in isolated microglia, and β2 receptor antagonists prolonged ATP effects in brain slice tissues, suggesting the presence of cross-talk between adrenergic and purinergic signaling in microglia. These data show that the neurotransmitter NE can modulate microglial motility, which could affect microglial functions in pathogenic situations of either elevated or reduced NE levels.
Keywords: Adrenergic Receptor; Brain Slice; Imaging; Microglia; Migration; Purinergic Receptor.
Figures
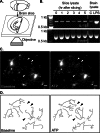
FIGURE 1.
Microglia in acute brain slices. A, 200-μm coronal cortical slices were prepared from CX3CR1-eGFP mice that have microglia-specific eGFP expression and imaged with a confocal microscope. B, IL-1β cytokine expression was assessed by RT-PCR using RNA isolated from acute brain slices. To compare cytokine expression in slices with normal brain, cortical lysates from PBS- (control) or LPS-injected (2 mg/kg intraperitoneally 2 days before slicing) animals were used as a control. C, maximum intensity projections of optical sections spanning 45 μm through representative cells before (left; t = 0 min) and following treatment with 30 μ
m
ATP (right; t = 7 min). Arrowheads point to select processes that change over time. Scale bars, 5 μm. D, microglial processes for still images shown in C were manually traced out for visualization and quantification.
FIGURE 2.
Microglial motility in slices. Coronal slices were prepared from CX3CR1-eGFP mice and imaged as described. A, maximum intensity projection of a 31-μm section from a slice before (left) and following application of 30 μ
m
NE (right). Arrowheads point to select processes that change over time. Scale bars, 5 μm. B, traced out processes for the cell shown in A. C, the total process length for each cell was calculated following ATP or NE treatment and normalized to the total process length during a 5-min baseline recording. D, process length of ATP- and NE-treated slices normalized to the average length of aCSF-treated slices at each time point. The numbers of cells analyzed for each treatment are shown in parentheses. Error bars, S.E. Statistical analysis was performed using two-way repeated measures ANOVA and Tukey's post hoc test. #, p < 0.05 compared with baseline response; *, p < 0.05 compared with aCSF at the corresponding time point.
FIGURE 3.
Expression of adrenergic receptors in microglia. A, quantitative real time PCR results for mouse adrenergic receptors in cortical lysates from PBS- (control) or LPS-injected (2 mg/kg) mice or purified primary microglia (MG) treated with 100 ng/ml LPS or HBSS (control) for 24 h. For each receptor, expression was calculated relative to cortical lysates of PBS-injected animals in three independent experiments, each performed in duplicate. Dotted line, relative expression = 1 compared with cortex. X, not detected. B, measurement of Ca2+ levels as a readout of Gq-linked receptor activation in primary microglia treated with HBSS (n = 12 cells) or 100 ng/ml LPS for 24 h (n = 15 cells). NE (30 μ
m
) and ATP (30 μ
m
; positive control) were each applied for 1 min. The average traces from all cells are shown. C, quantification of the maximum Fura-2 response following NE or ATP treatment. Error bars, S.E. Statistical analysis was performed using two-way repeated measures ANOVA and Tukey's post hoc test. *, p < 0.05.
FIGURE 4.
Imaging of primary microglia in Matrigel in vitro. Three-dimensional reconstructions of primary actin-eGFP microglia plated in Matrigel capture the complex, process-bearing morphology of primary microglia. The figure shows an example of a resting, HBSS-treated microglia (control; A) or a microglia activated with 100 ng/ml LPS (B). Treatment with 30 μ
m
NE induced process retraction in both cases. Changes in the surface area-to-volume ratios (SA/V) correlate to changes in ramification. Scale bars, 10 μm.
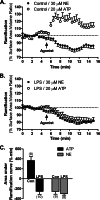
FIGURE 5.
Control of microglial process dynamics by adrenergic receptors in vitro. Three-dimensional representations of primary actin-eGFP microglia plated in Matrigel were used to calculate cell ramification as surface area-to-volume ratios at each time point. HBSS-treated (control (Con); A) or LPS-activated microglia (100 ng/ml for 24 h; B) were treated with either 20 μ
m
ATP or 30 μ
m
NE. C, a comparison of the effects of NE and ATP by calculating the area under the ramification curves. The number of cells for each treatment is shown in parentheses. Error bars, S.E.
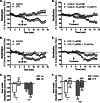
FIGURE 6.
Mechanisms underlying the NE-regulated changes in microglial process dynamics. Primary actin-eGFP microglia were imaged in Matrigel to calculate cell ramification as surface area-to-volume ratios as described. A–C, effects of adrenergic agonists. Treatment of HBSS- (control (Con)) or LPS-treated (100 ng/ml for 24 h) microglia with the β2 receptor agonist isoproterenol (Iso; 10 μ
m
; A) or the α2A receptor agonist UK-14,304 (UK; 10 μ
m
; B). D–F, effects of adrenergic antagonists. D, treatment of HBSS-treated (control) microglia with 30 μ
m
NE alone or 30 μ
m
NE and the β receptor antagonist propranolol (Pro; 10 μ
m
). E, treatment of LPS-activated (100 ng/ml for 24 h) microglia with 3 μ
m
NE alone or 3 μ
m
NE and the α receptor antagonist phentolamine (Phe; 10 μ
m
). The effects of NE receptor agonists (C) and antagonists (F) were compared by calculating the area under the ramification curves with the number of cells for each treatment shown in parentheses. Error bars, S.E. Statistical analysis was performed using two-way ANOVA and Bonferroni's post hoc test compared with control (C) or NE-treated (F) cells. *, p < 0.05.
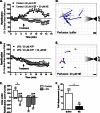
FIGURE 7.
Interaction between purinergic and adrenergic signaling in regulating microglial motility in vitro. Primary actin-eGFP microglia were imaged in Matrigel to calculate cell ramification as surface area-to-volume ratios as described. A–C, HBSS-treated (control; A) or LPS-activated microglia (100 ng/ml for 24 h; B) were treated with either 20 μ
m
ATP or 20 μ
m
ATP + 30 μ
m
NE. C, quantification of cell ramification with the number of cells for each treatment shown in parentheses. Statistical analysis was performed using two-way ANOVA and Bonferroni's post hoc test compared with ATP-treated cells. *, p < 0.05. D–F, migration of primary actin-eGFP microglia to ATP released from a micropipette. The cells were perfused with either imaging buffer (D) or 30 μ
m
NE (E). Paths of cell bodies were tracked with Bitplane Imaris and are shown in light gray; overall displacements are represented by blue (movement to pipette) or red (movement away) arrows. Scale bars, 5 μm. F, movement was quantified by measuring the magnitude of the vector displacement for each cell with positive displacement being movement toward the pipette. The number of cells for each treatment is shown in parentheses. Error bars, S.E. Statistical analysis was performed using Student's t test. *, p < 0.05.
FIGURE 8.
Interaction between purinergic and adrenergic signaling in regulating microglial motility in tissues. Coronal slices were prepared from CX3CR1-eGFP mice and imaged as described. The total process length of microglial processes in two-dimensional projections following ATP treatment was normalized to the total process length during baseline with the numbers of cells for each treatment shown in parentheses. Error bars, S.E. Statistical analysis was performed using two-way repeated measures ANOVA and Tukey's post hoc test. #, p < 0.05 compared with baseline response; *, p < 0.05 compared with ATP at the corresponding time point. Pro, propranolol.
FIGURE 9.
A summary of the regulation of microglial motility by adrenergic and purinergic receptors. A, resting microglia express the purinergic P2Y12 and the β2-adrenergic (AR) receptors. Activation of the Gi-coupled P2Y12 receptors (P2Y12-R) by ATP results in process extension and migration to ATP possibly through PKC, β-arrestin-2 (β_-arr-2_)-mediated activation of ERK1/2, or Rac signaling. In contrast, β2 receptor activation by NE leads to process retraction and block of ATP-induced process extension and migration. Either Gi, Gs, or both types of G proteins might be involved in β2 receptor signaling. B, LPS-activated microglia express the purinergic A2A and the α2A-adrenergic receptors. Adenosine, a breakdown product of ATP, activates A2A receptors (A2A-R) to induce process retraction in a PKA-dependent manner. NE activation of α2A receptors also leads to process retraction. See text for references.
Similar articles
- Effects of norepinephrine on rat cultured microglial cells that express alpha1, alpha2, beta1 and beta2 adrenergic receptors.
Mori K, Ozaki E, Zhang B, Yang L, Yokoyama A, Takeda I, Maeda N, Sakanaka M, Tanaka J. Mori K, et al. Neuropharmacology. 2002 Nov;43(6):1026-34. doi: 10.1016/s0028-3908(02)00211-3. Neuropharmacology. 2002. PMID: 12423672 - Distinct P2Y Receptors Mediate Extension and Retraction of Microglial Processes in Epileptic and Peritumoral Human Tissue.
Milior G, Morin-Brureau M, Chali F, Le Duigou C, Savary E, Huberfeld G, Rouach N, Pallud J, Capelle L, Navarro V, Mathon B, Clemenceau S, Miles R. Milior G, et al. J Neurosci. 2020 Feb 12;40(7):1373-1388. doi: 10.1523/JNEUROSCI.0218-19.2019. Epub 2020 Jan 2. J Neurosci. 2020. PMID: 31896671 Free PMC article. - Norepinephrine modulates glutamatergic transmission in the bed nucleus of the stria terminalis.
Egli RE, Kash TL, Choo K, Savchenko V, Matthews RT, Blakely RD, Winder DG. Egli RE, et al. Neuropsychopharmacology. 2005 Apr;30(4):657-68. doi: 10.1038/sj.npp.1300639. Neuropsychopharmacology. 2005. PMID: 15602500 - Differential regulation of microglial motility by ATP/ADP and adenosine.
Gyoneva S, Orr AG, Traynelis SF. Gyoneva S, et al. Parkinsonism Relat Disord. 2009 Dec;15 Suppl 3(Suppl 3):S195-9. doi: 10.1016/S1353-8020(09)70813-2. Parkinsonism Relat Disord. 2009. PMID: 20082989 Free PMC article. Review. - Regulation of Microglial Functions by Purinergic Mechanisms in the Healthy and Diseased CNS.
Illes P, Rubini P, Ulrich H, Zhao Y, Tang Y. Illes P, et al. Cells. 2020 Apr 29;9(5):1108. doi: 10.3390/cells9051108. Cells. 2020. PMID: 32365642 Free PMC article. Review.
Cited by
- Enhancing glymphatic fluid transport by pan-adrenergic inhibition suppresses epileptogenesis in male mice.
Sun Q, Peng S, Xu Q, Weikop P, Hussain R, Song W, Nedergaard M, Ding F. Sun Q, et al. Nat Commun. 2024 Nov 6;15(1):9600. doi: 10.1038/s41467-024-53430-y. Nat Commun. 2024. PMID: 39505840 - Lethal versus surviving sepsis phenotypes displayed a partly differential regional expression of neurotransmitters and inflammation and did not modify the blood-brain barrier permeability in female CLP mice.
Azizian-Farsani F, Weixelbaumer K, Mascher D, Klang A, Högler S, Dinhopl N, Bauder B, Weissenböck H, Tichy A, Schmidt P, Mascher H, Osuchowski MF. Azizian-Farsani F, et al. Intensive Care Med Exp. 2024 Nov 4;12(1):96. doi: 10.1186/s40635-024-00688-7. Intensive Care Med Exp. 2024. PMID: 39497013 Free PMC article. - Monoamine alterations in Alzheimer's disease and their implications in comorbid neuropsychiatric symptoms.
Saggu S, Bai A, Aida M, Rehman H, Pless A, Ware D, Deak F, Jiao K, Wang Q. Saggu S, et al. Geroscience. 2024 Sep 27. doi: 10.1007/s11357-024-01359-x. Online ahead of print. Geroscience. 2024. PMID: 39331291 Review. - Receptors on Microglia.
Augusto-Oliveira M, Tremblay MÈ, Verkhratsky A. Augusto-Oliveira M, et al. Adv Neurobiol. 2024;37:83-121. doi: 10.1007/978-3-031-55529-9_6. Adv Neurobiol. 2024. PMID: 39207688 Review. - Dexmedetomidine directly binds to and inhibits Toll-like receptor 4.
Koutsogiannaki S, Limratana P, Bu W, Maisat W, McKinstry-Wu A, Han X, Ohto U, Eckenhoff RG, Soriano SG, Yuki K. Koutsogiannaki S, et al. Int Immunopharmacol. 2024 Nov 15;141:112975. doi: 10.1016/j.intimp.2024.112975. Epub 2024 Aug 19. Int Immunopharmacol. 2024. PMID: 39163686
References
- Iversen L. L., Rossor M. N., Reynolds G. P., Hills R., Roth M., Mountjoy C. Q., Foote S. L., Morrison J. H., Bloom F. E. (1983) Loss of pigmented dopamine-β-hydroxylase positive cells from locus coeruleus in senile dementia of Alzheimer's type. Neurosci. Lett. 39, 95–100 - PubMed
- German D. C., Manaye K. F., White C. L., 3rd, Woodward D. J., McIntire D. D., Smith W. K., Kalaria R. N., Mann D. M. (1992) Disease-specific patterns of locus coeruleus cell loss. Ann. Neurol. 32, 667–676 - PubMed
- Leverenz J. B., Miller M. A., Dobie D. J., Peskind E. R., Raskind M. A. (2001) Increased α2-adrenergic receptor binding in locus coeruleus projection areas in dementia with Lewy bodies. Neurobiol. Aging 22, 555–561 - PubMed
- Mann D. M., Lincoln J., Yates P. O., Stamp J. E., Toper S. (1980) Changes in the monoamine containing neurones of the human CNS in senile dementia. Br. J. Psychiatry 136, 533–541 - PubMed
- Chan-Palay V., Asan E. (1989) Alterations in catecholamine neurons of the locus coeruleus in senile dementia of the Alzheimer type and in Parkinson's disease with and without dementia and depression. J. Comp. Neurol. 287, 373–392 - PubMed
Publication types
MeSH terms
Substances
Grants and funding
- T32 GM008602/GM/NIGMS NIH HHS/United States
- P50-NS071669/NS/NINDS NIH HHS/United States
- T32 ES012870/ES/NIEHS NIH HHS/United States
- 1F31NS076215/NS/NINDS NIH HHS/United States
- T32GM008602/GM/NIGMS NIH HHS/United States
- 5T32ES12870/ES/NIEHS NIH HHS/United States
- P50 NS071669/NS/NINDS NIH HHS/United States
- F31 NS076215/NS/NINDS NIH HHS/United States
LinkOut - more resources
Full Text Sources
Other Literature Sources


