The genomic and transcriptomic landscape of a HeLa cell line - PubMed (original) (raw)
. 2013 Aug 7;3(8):1213-24.
doi: 10.1534/g3.113.005777.
Paul Theodor Pyl, Tobias Rausch, Thomas Zichner, Manu M Tekkedil, Adrian M Stütz, Anna Jauch, Raeka S Aiyar, Gregoire Pau, Nicolas Delhomme, Julien Gagneur, Jan O Korbel, Wolfgang Huber, Lars M Steinmetz
Affiliations
- PMID: 23550136
- PMCID: PMC3737162
- DOI: 10.1534/g3.113.005777
The genomic and transcriptomic landscape of a HeLa cell line
Jonathan J M Landry et al. G3 (Bethesda). 2013.
Abstract
HeLa is the most widely used model cell line for studying human cellular and molecular biology. To date, no genomic reference for this cell line has been released, and experiments have relied on the human reference genome. Effective design and interpretation of molecular genetic studies performed using HeLa cells require accurate genomic information. Here we present a detailed genomic and transcriptomic characterization of a HeLa cell line. We performed DNA and RNA sequencing of a HeLa Kyoto cell line and analyzed its mutational portfolio and gene expression profile. Segmentation of the genome according to copy number revealed a remarkably high level of aneuploidy and numerous large structural variants at unprecedented resolution. Some of the extensive genomic rearrangements are indicative of catastrophic chromosome shattering, known as chromothripsis. Our analysis of the HeLa gene expression profile revealed that several pathways, including cell cycle and DNA repair, exhibit significantly different expression patterns from those in normal human tissues. Our results provide the first detailed account of genomic variants in the HeLa genome, yielding insight into their impact on gene expression and cellular function as well as their origins. This study underscores the importance of accounting for the strikingly aberrant characteristics of HeLa cells when designing and interpreting experiments, and has implications for the use of HeLa as a model of human biology.
Keywords: HeLa cell line; genomics; resource; transcriptomics; variation.
Figures
Figure 1
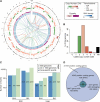
The genomic landscape of a HeLa cell line. (A) Circos plot (Krzywinski et al. 2009) of the HeLa genome with tracks representing read depth (100 kb-binned coverage), CN (color gradient from light green for CN1 to dark red for CN10), zygosity (pink: heterozygous; purple: homozygous), SNV density (1-Mb binned SNV count; darker blue for greater density), and translocation calls (colored arcs based on paired-end sequencing data: light blue; mate pair data: light green; both datasets: orange). (B) Histogram of called CN across the genome in percent. CN 0 corresponds to coverage less than half of the expected value for CN 1. A CN value of “NA” means no call could be made with confidence ≥0.95 (see Materials and Methods). (C) Overview of sequence variation in HeLa. Numbers of SNV and indel calls in HeLa, classified by overlap with dbSNP and the 1000 Genomes Project (dbSNP137). The y-axis shows the counts on a logarithmic scale. The four different classes of events represented on the x-axis are homozygous (“Hom.”) and heterozygous (“Het.”) SNVs and indels. (D) Variation observed in HeLa protein-coding genes relative to the human reference. Number of protein-coding genes containing SNVs, nonsynonymous SNVs, and damaging non-synonymous mutations [predicted by SIFT (Ng and Henikoff 2003)].
Figure 2
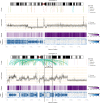
SVs, CN, zygosity and allele frequency along chromosomes 3 and 11. Arcs in the top panels labeled “Events” represent the predicted connections between fragments derived from SV calls based on read pair orientation and spacing. Different read pair signatures indicate the following event types: deletions, tandem duplications, inversions, and interchromosomal translocations. The center panel (“Copy Number”) represents the CN estimates in 10-kb bins (gray) overlaid with their segmentation (black). The associated CN is shown on the y-axis. The zygosity track shows the proportion of homozygous SNV calls in 10-kb bins; darker purple regions contain more homozygous calls (up to 100%) and indicate potential LOH. The bottom panel shows the allele frequency distribution as a heatmap in 10-kb bins on the chromosome axis and 5% bins on the allele frequency axis; darker blue indicates more SNVs with the given allele frequency in the corresponding 10 kb region. The color scale is according to the log of proportion of SNVs falling into the allele frequency bin (e.g., 10–15%, i.e., the row) in the 10 kb region (i.e., the column). The chromosomal subregion 11q13, which is known to contain tumor-suppressor genes, is delineated with black bars.
Figure 3
Colored HeLa karyotype by M-FISH. M-FISH results of 12 analyzed metaphase spreads identified a hypotriploid karyotype. The karyotype shown in (A) was derived from a single cell in which all aberrations were recurrent except for the one in chromosome 3. Single cell-specific events are shown in (B).
Figure 4
A general lack of dosage compensation observed in HeLa gene expression. (A) Correlation between CN and gene expression levels. Empirical cumulative distribution functions of gene expression values (for genes detected as expressed), grouped by CN state of the region containing the gene. The x-axis shows the logarithm (base 10) of read counts per kb of gene and the y-axis shows the corresponding cumulative distribution function. Significance (*) was calculated by the Wilcoxon test (P < 0.01). (B) Lack of allele-specific dosage compensation. For each SNV in genome segments of CN 3, the higher and lower RNA-Seq read count for both alleles are shown (higher count on the y-axis, lower count on the x-axis). The two dashed lines represent ratios 2:1 and 1:1. The observed ratios center around the 2:1 line, indicating an overall lack of allele-specific dosage compensation.
Comment in
- The fractured genome of HeLa cells.
Mittelman D, Wilson JH. Mittelman D, et al. Genome Biol. 2013 Apr 17;14(4):111. doi: 10.1186/gb-2013-14-4-111. Genome Biol. 2013. PMID: 23594443 Free PMC article.
Similar articles
- HeLa-CCL2 cell heterogeneity studied by single-cell DNA and RNA sequencing.
Hu WE, Zhang X, Guo QF, Yang JW, Yang Y, Wei SC, Su XD. Hu WE, et al. PLoS One. 2019 Dec 2;14(12):e0225466. doi: 10.1371/journal.pone.0225466. eCollection 2019. PLoS One. 2019. PMID: 31790455 Free PMC article. - The haplotype-resolved genome and epigenome of the aneuploid HeLa cancer cell line.
Adey A, Burton JN, Kitzman JO, Hiatt JB, Lewis AP, Martin BK, Qiu R, Lee C, Shendure J. Adey A, et al. Nature. 2013 Aug 8;500(7461):207-11. doi: 10.1038/nature12064. Nature. 2013. PMID: 23925245 Free PMC article. - High variability of genomic instability and gene expression profiling in different HeLa clones.
Frattini A, Fabbri M, Valli R, De Paoli E, Montalbano G, Gribaldo L, Pasquali F, Maserati E. Frattini A, et al. Sci Rep. 2015 Oct 20;5:15377. doi: 10.1038/srep15377. Sci Rep. 2015. PMID: 26483214 Free PMC article. - Genomics and the Immune Landscape of Osteosarcoma.
Wu CC, Livingston JA. Wu CC, et al. Adv Exp Med Biol. 2020;1258:21-36. doi: 10.1007/978-3-030-43085-6_2. Adv Exp Med Biol. 2020. PMID: 32767232 Review. - Understanding genomic alterations in cancer genomes using an integrative network approach.
Wang E. Wang E. Cancer Lett. 2013 Nov 1;340(2):261-9. doi: 10.1016/j.canlet.2012.11.050. Epub 2012 Dec 22. Cancer Lett. 2013. PMID: 23266571 Review.
Cited by
- Fusion transcript detection using spatial transcriptomics.
Friedrich S, Sonnhammer ELL. Friedrich S, et al. BMC Med Genomics. 2020 Aug 4;13(1):110. doi: 10.1186/s12920-020-00738-5. BMC Med Genomics. 2020. PMID: 32753032 Free PMC article. - HeLa-CCL2 cell heterogeneity studied by single-cell DNA and RNA sequencing.
Hu WE, Zhang X, Guo QF, Yang JW, Yang Y, Wei SC, Su XD. Hu WE, et al. PLoS One. 2019 Dec 2;14(12):e0225466. doi: 10.1371/journal.pone.0225466. eCollection 2019. PLoS One. 2019. PMID: 31790455 Free PMC article. - Mapping genome-wide transcription factor binding sites in frozen tissues.
Savic D, Gertz J, Jain P, Cooper GM, Myers RM. Savic D, et al. Epigenetics Chromatin. 2013 Sep 16;6(1):30. doi: 10.1186/1756-8935-6-30. Epigenetics Chromatin. 2013. PMID: 24279905 Free PMC article. - Sensing of HIV-1 Infection in Tzm-bl Cells with Reconstituted Expression of STING.
Trotard M, Tsopoulidis N, Tibroni N, Willemsen J, Binder M, Ruggieri A, Fackler OT. Trotard M, et al. J Virol. 2015 Dec 9;90(4):2064-76. doi: 10.1128/JVI.02966-15. Print 2016 Feb 15. J Virol. 2015. PMID: 26656698 Free PMC article. - Three-dimensional bio-printing: A new frontier in oncology research.
Charbe N, McCarron PA, Tambuwala MM. Charbe N, et al. World J Clin Oncol. 2017 Feb 10;8(1):21-36. doi: 10.5306/wjco.v8.i1.21. World J Clin Oncol. 2017. PMID: 28246583 Free PMC article. Review.
References
Publication types
MeSH terms
LinkOut - more resources
Full Text Sources
Other Literature Sources
Molecular Biology Databases
Research Materials


