Association mapping and the genomic consequences of selection in sunflower - PubMed (original) (raw)
Association mapping and the genomic consequences of selection in sunflower
Jennifer R Mandel et al. PLoS Genet. 2013 Mar.
Abstract
The combination of large-scale population genomic analyses and trait-based mapping approaches has the potential to provide novel insights into the evolutionary history and genome organization of crop plants. Here, we describe the detailed genotypic and phenotypic analysis of a sunflower (Helianthus annuus L.) association mapping population that captures nearly 90% of the allelic diversity present within the cultivated sunflower germplasm collection. We used these data to characterize overall patterns of genomic diversity and to perform association analyses on plant architecture (i.e., branching) and flowering time, successfully identifying numerous associations underlying these agronomically and evolutionarily important traits. Overall, we found variable levels of linkage disequilibrium (LD) across the genome. In general, islands of elevated LD correspond to genomic regions underlying traits that are known to have been targeted by selection during the evolution of cultivated sunflower. In many cases, these regions also showed significantly elevated levels of differentiation between the two major sunflower breeding groups, consistent with the occurrence of divergence due to strong selection. One of these regions, which harbors a major branching locus, spans a surprisingly long genetic interval (ca. 25 cM), indicating the occurrence of an extended selective sweep in an otherwise recombinogenic interval.
Conflict of interest statement
This study was funded by Advanta Semillas, Dow Agrosciences, Pioneer Hi-Bred, and Syngenta. There are no patents, products in development, or marketed products to declare. This does not alter the authors' adherence to all the PLOS Genetics policies on sharing data and materials, as detailed online in the guide for authors.
Figures
Figure 1. STRUCTURE plot of the sunflower association mapping panel with K = 3 clusters based on all polymorphic SNP markers.
The plot is sorted according to line classification. I-HA = INRA-HA, HA-NO = HA-non-oil, HA-O = HA-oil, I-RHA = INRA-RHA, RHA-NO = RHA-non-oil, RHA-O = RHA-oil, The four “Other” categories refer to non-oil lines, oil lines, open pollinated varieties and landraces, and introgressed lines, respectively.
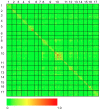
Figure 2. Heat map of linkage disequilibrium across the sunflower genome.
Individual data points reflect squared allele frequency correlations (r2) for all possible pairs of polymorphic SNP markers, MAF ≥10%. The x- and y-axes correspond to the 17 linkage groups in sunflower with marker orders based on the work of Bowers et al. . Note that the values above and below the diagonal are identical.
Figure 3. r2 sliding window analysis.
Sliding window analysis of squared allele frequency correlations (r2) across the sunflower genome.
Figure 4. FST between heterotic groups.
Population genetic differentiation (FST) between heterotic groups (RHA vs. HA lines) for polymorphic SNPs, MAF ≥10%, plotted against genetic map position. The red colored dots represent individual SNPs that showed evidence of divergence due to selection in the outlier analysis.
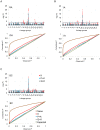
Figure 5. Manhattan and quantile–quantile plots of branching associations.
(A, B, C) Upper panels: Manhattan plots of branching associations in three locations (GA, IA, BC respectively) plotted for the three models tested: red = K, blue = P+K, dark grey = Q3+K. The dashed line indicates the significance threshold based on the multiple testing correction method of Gao et al. (alpha = 0.05, P = 0.00025, log 1/P = 3.60). Lower panels: Quantile-quantile plots of branching associations in all three locations plotted for the three models tested.
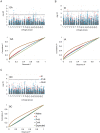
Figure 6. Manhattan and quantile–quantile plots of flowering time associations.
(A, B, C) Upper panels: Manhattan plots of flowering (DTF) associations in three locations (GA, IA, BC respectively) plotted for the three models tested: red = K, blue = P+K, dark grey = Q3+K. The dashed line indicates the significance threshold based on the multiple testing correction method of Gao et al. (alpha = 0.05, P = 0.00025, log 1/P = 3.60). Lower panels: Quantile-quantile plots of flowering time associations in all three locations plotted for the three models tested.
Figure 7. Graphical genotypes from linkage group 10.
Graphical genotypes from linkage group 10 plotted against a heat map of the branching data sorted by average level of branching across all three locations. Unbranched plants (red) are to the left whereas highly branched plants (green) are to the right. Note that the scale of the y-axis scale changes based on marker density, and white squares in the phenotype heat map represent missing data in an individual location.
Similar articles
- A genomic scan for selection reveals candidates for genes involved in the evolution of cultivated sunflower (Helianthus annuus).
Chapman MA, Pashley CH, Wenzler J, Hvala J, Tang S, Knapp SJ, Burke JM. Chapman MA, et al. Plant Cell. 2008 Nov;20(11):2931-45. doi: 10.1105/tpc.108.059808. Epub 2008 Nov 18. Plant Cell. 2008. PMID: 19017747 Free PMC article. - Association mapping in sunflower (Helianthus annuus L.) reveals independent control of apical vs. basal branching.
Nambeesan SU, Mandel JR, Bowers JE, Marek LF, Ebert D, Corbi J, Rieseberg LH, Knapp SJ, Burke JM. Nambeesan SU, et al. BMC Plant Biol. 2015 Mar 11;15:84. doi: 10.1186/s12870-015-0458-9. BMC Plant Biol. 2015. PMID: 25887675 Free PMC article. - Evidence of selection on fatty acid biosynthetic genes during the evolution of cultivated sunflower.
Chapman MA, Burke JM. Chapman MA, et al. Theor Appl Genet. 2012 Sep;125(5):897-907. doi: 10.1007/s00122-012-1881-z. Epub 2012 May 12. Theor Appl Genet. 2012. PMID: 22580969 - Understanding and utilizing crop genome diversity via high-resolution genotyping.
Voss-Fels K, Snowdon RJ. Voss-Fels K, et al. Plant Biotechnol J. 2016 Apr;14(4):1086-94. doi: 10.1111/pbi.12456. Epub 2015 Aug 19. Plant Biotechnol J. 2016. PMID: 27003869 Review.
Cited by
- Genomic Insights into Disease Resistance in Sunflower (Helianthus annuus): Identifying Key Regions and Candidate Genes for Verticillium dahliae Resistance.
Yu Y, Yang J, Zhang J, Rieseberg LH, Zhao J. Yu Y, et al. Plants (Basel). 2024 Sep 14;13(18):2582. doi: 10.3390/plants13182582. Plants (Basel). 2024. PMID: 39339557 Free PMC article. - Dissecting the Genetic Architecture of Morphological Traits in Sunflower (Helianthus annuus L.).
Delen Y, Palali-Delen S, Xu G, Neji M, Yang J, Dweikat I. Delen Y, et al. Genes (Basel). 2024 Jul 19;15(7):950. doi: 10.3390/genes15070950. Genes (Basel). 2024. PMID: 39062729 Free PMC article. - Trait variation and performance across varying levels of drought stress in cultivated sunflower (Helianthus annuus L.).
Earley AM, Nolting KM, Donovan LA, Burke JM. Earley AM, et al. AoB Plants. 2024 May 27;16(4):plae031. doi: 10.1093/aobpla/plae031. eCollection 2024 Jul. AoB Plants. 2024. PMID: 39011498 Free PMC article. - Candidate pathway association and genome-wide association approaches reveal alternative genetic architectures of carotenoid content in cultivated sunflower (Helianthus annuus).
Dowell JA, Mason C. Dowell JA, et al. Appl Plant Sci. 2023 Dec 2;11(6):e11558. doi: 10.1002/aps3.11558. eCollection 2023 Nov-Dec. Appl Plant Sci. 2023. PMID: 38106540 Free PMC article. - Genetic diversity in Sickleweed (Falcaria vulgaris) and using stepwise regression to identify marker associated with traits.
Rahimi M, AhmadiAfzadi M, Kordrostami M. Rahimi M, et al. Sci Rep. 2023 Jul 26;13(1):12142. doi: 10.1038/s41598-023-39419-5. Sci Rep. 2023. PMID: 37495658 Free PMC article.
References
- Wang E, Wang J, Zhu X, Hao W, Wang L, et al. (2008) Control of rice grain-filling and yield by a gene with a potential signature of domestication. Nat Genet 40: 1370–1374 doi:10.1038/ng.220. - DOI - PubMed
- Casa AM, Mitchell SE, Hamblin MT, Sun H, Bowers JE, et al. (2005) Diversity and selection in sorghum: simultaneous analyses using simple sequence repeats. Theor Appl Genet 111: 23–30. - PubMed
Publication types
MeSH terms
Grants and funding
This work was supported by funding from the USDA National Institute of Food and Agriculture (2008-35300-19263), the NSF Plant Genome Research Program (DBI-0820451), the USDA/DOE Plant Feedstocks Genomics Joint Program (ER 64664), Genome BC (http://www.genomebc.ca), Genome Canada (http://www.genomecanada.ca), Advanta Semillas (http://www.advantasemillas.com.ar/en/#/prehome), Dow Agrosciences (www.dowagro.com/), Pioneer Hi-Bred (pioneer.com), Syngenta (syngenta.com), and the Georgia Research Alliance (gra.org). The funders had no role in study design, data collection and analysis, decision to publish, or preparation of the manuscript.
LinkOut - more resources
Full Text Sources
Other Literature Sources
Research Materials


