Modeling Tumor-Associated Edema in Gliomas during Anti-Angiogenic Therapy and Its Impact on Imageable Tumor - PubMed (original) (raw)
Modeling Tumor-Associated Edema in Gliomas during Anti-Angiogenic Therapy and Its Impact on Imageable Tumor
Andrea Hawkins-Daarud et al. Front Oncol. 2013.
Abstract
Glioblastoma, the most aggressive form of primary brain tumor, is predominantly assessed with gadolinium-enhanced T1-weighted (T1Gd) and T2-weighted magnetic resonance imaging (MRI). Pixel intensity enhancement on the T1Gd image is understood to correspond to the gadolinium contrast agent leaking from the tumor-induced neovasculature, while hyperintensity on the T2/FLAIR images corresponds with edema and infiltrated tumor cells. None of these modalities directly show tumor cells; rather, they capture abnormalities in the microenvironment caused by the presence of tumor cells. Thus, assessing disease response after treatments impacting the microenvironment remains challenging through the obscuring lens of MR imaging. Anti-angiogenic therapies have been used in the treatment of gliomas with spurious results ranging from no apparent response to significant imaging improvement with the potential for extremely diffuse patterns of tumor recurrence on imaging and autopsy. Anti-angiogenic treatment normalizes the vasculature, effectively decreasing vessel permeability and thus reducing tumor-induced edema, drastically altering T2-weighted MRI. We extend a previously developed mathematical model of glioma growth to explicitly incorporate edema formation allowing us to directly characterize and potentially predict the effects of anti-angiogenics on imageable tumor growth. A comparison of simulated glioma growth and imaging enhancement with and without bevacizumab supports the current understanding that anti-angiogenic treatment can serve as a surrogate for steroids and the clinically driven hypothesis that anti-angiogenic treatment may not have any significant effect on the growth dynamics of the overall tumor cell populations. However, the simulations do illustrate a potentially large impact on the level of edematous extracellular fluid, and thus on what would be imageable on T2/FLAIR MR. Additionally, by evaluating virtual tumors with varying growth kinetics, we see tumors with lower proliferation rates will have the most reduction in swelling from such treatments.
Keywords: anti-angiogenic therapy; edema; glioma; mathematical model.
Figures
Figure 1
Illustration of primary imaging modalities. The T1Gd image will show enhancement where the contrast agent has been able to diffuse into the extracellular space where the blood brain barrier has been compromised due to tumor-induced neo-angiogenesis. The T2-weighted and FLAIR images are associated with edema or swelling; FLAIR is different from T2 in that the signal from the cerebral spinal fluid (CSF) is removed. In the case of GBM, the non-CSF T2/FLAIR enhancement is primarily vasogenic edema, defined as fluid originating from blood vessels that accumulates around cells (Marmarou, 2007). The fluid leaves the vessels due to pressure and osmotic gradients induced by the breakdown in the blood brain barrier.
Figure 2
Four patients with varying imageable responses to anti-angiogenic treatment. Treatment period indicated with gray box on radius plots. (A) Patient 1: A 48-year-old male with Grade III glioma is seen to have significant reduction of enhancing lesion during treatment but recurs almost immediately after treatment is stopped, (B) Patient 2: a 55-year-old male with GBM initially responds to treatment but even while being treated the enhancing region is seen to enlarge again, (C) Patient 3: a 61-year-old male with GBM seems to have no response to treatment and the enhancing region seems to grow faster after treatment, and (D) Patient 4: a 66-year-old female with GBM has imaging stabilized during treatment, but enhancing region begins growing again once treatment is stopped.
Figure 3
Schematic of the PIHNA-E model. The main components of the model are seen in the flow chart: c represents the normoxic glioma cells, h the hypoxic gliomas cells, v the vascular endothelial cells, n the necrotic cells, a, the angiogenic factors, and l the edematous fluid. Depending on the level of oxygen, normoxic, and hypoxic cells will undergo phenotypic switching. If oxygen levels fall too far and are not compensated for by sufficient angiogenesis, the hypoxic cells will undergo necrosis. Additionally, all cells will undergo necrosis if in contact with necrotic cells. Both hypoxic and normoxic cells release angiogenic factors into the extracellular space which recruit additional vasculature to increase the levels of oxygen. The angiogenic factors are removed from the system by interaction with vascular cells or natural decay. The local levels of angiogenic factors are indicative of the local degree of vessel permeability. Edematous liquid exits the vasculature where the permeability, _K_trans(a), allows and enters the extracellular space where it diffuses and will be removed at rate dl.
Figure 4
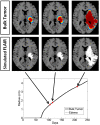
Illustrated here is the comparison of the simulated disease burden to what would be imageable on a FLAIR MRI in an untreated context for one set of growth parameters corresponding to an aggressive GBM. Below the plot shows the spherically symmetric equivalent radial growth of the regions containing tumor cells above a threshold and edematous fluid above a threshold. In the untreated context, these lines are nearly identical.
Figure 5
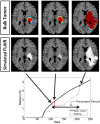
Comparison of the simulated disease burden to what would be imageable on a FLAIR MRI in a treated context for the same set of growth parameters as shown in Figure 4. Below the plot shows the spherically symmetric equivalent radial growth of the regions containing tumor cells above a threshold and edematous fluid above a threshold. Once treatment has begun, we see a drop in the levels of edema. Upon termination of the treatment, the edematous volume is seen to once again increase to the same size of the volume of tumorous cells.
Figure 6
Using the PIHNA-E model, holding all parameters constant except for D and ρ, one can observe many different responses to anti-angiogenic treatment in terms of the levels of edema. These responses vary from complete disappearance of imageable edema to stabilized lower levels to lowered levels of edema that continue to increase. When treatment is terminated, however, edema levels are always seen rise to once again reflect more closely the underlying disease burden. Treatment times are indicated by the gray boxes. These simulations suggest that the majority of imaging responses can be explained by considering how the drug impacts the tumor microenvironment alone without cytotoxic affects. Additionally, they represent a possible mechanism for identifying the patients who will receive significant benefit from the treatment.
Similar articles
- Complementary but distinct roles for MRI and 18F-fluoromisonidazole PET in the assessment of human glioblastomas.
Swanson KR, Chakraborty G, Wang CH, Rockne R, Harpold HL, Muzi M, Adamsen TC, Krohn KA, Spence AM. Swanson KR, et al. J Nucl Med. 2009 Jan;50(1):36-44. doi: 10.2967/jnumed.108.055467. Epub 2008 Dec 17. J Nucl Med. 2009. PMID: 19091885 Free PMC article. - Relationship between contrast enhancement on fluid-attenuated inversion recovery MR sequences and signal intensity on T2-weighted MR images: visual evaluation of brain tumors.
Kubota T, Yamada K, Kizu O, Hirota T, Ito H, Ishihara K, Nishimura T. Kubota T, et al. J Magn Reson Imaging. 2005 Jun;21(6):694-700. doi: 10.1002/jmri.20331. J Magn Reson Imaging. 2005. PMID: 15906343 - Tumor invasion after treatment of glioblastoma with bevacizumab: radiographic and pathologic correlation in humans and mice.
de Groot JF, Fuller G, Kumar AJ, Piao Y, Eterovic K, Ji Y, Conrad CA. de Groot JF, et al. Neuro Oncol. 2010 Mar;12(3):233-42. doi: 10.1093/neuonc/nop027. Epub 2010 Jan 6. Neuro Oncol. 2010. PMID: 20167811 Free PMC article. - Advances in MRI assessment of gliomas and response to anti-VEGF therapy.
Pope WB, Young JR, Ellingson BM. Pope WB, et al. Curr Neurol Neurosci Rep. 2011 Jun;11(3):336-44. doi: 10.1007/s11910-011-0179-x. Curr Neurol Neurosci Rep. 2011. PMID: 21234719 Free PMC article. Review. - Imaging biomarkers guided anti-angiogenic therapy for malignant gliomas.
Kong Z, Yan C, Zhu R, Wang J, Wang Y, Wang Y, Wang R, Feng F, Ma W. Kong Z, et al. Neuroimage Clin. 2018 Jul 5;20:51-60. doi: 10.1016/j.nicl.2018.07.001. eCollection 2018. Neuroimage Clin. 2018. PMID: 30069427 Free PMC article. Review.
Cited by
- Automated glioblastoma patient classification using hypoxia levels measured through magnetic resonance images.
Shahram MA, Azimian H, Abbasi B, Ganji Z, Khadem-Reza ZK, Khakshour E, Zare H. Shahram MA, et al. BMC Neurosci. 2024 May 25;25(1):26. doi: 10.1186/s12868-024-00871-2. BMC Neurosci. 2024. PMID: 38789970 Free PMC article. - Opportunities for improving brain cancer treatment outcomes through imaging-based mathematical modeling of the delivery of radiotherapy and immunotherapy.
Hormuth DA 2nd, Farhat M, Christenson C, Curl B, Chad Quarles C, Chung C, Yankeelov TE. Hormuth DA 2nd, et al. Adv Drug Deliv Rev. 2022 Aug;187:114367. doi: 10.1016/j.addr.2022.114367. Epub 2022 May 30. Adv Drug Deliv Rev. 2022. PMID: 35654212 Free PMC article. Review. - Deep Learning for Reaction-Diffusion Glioma Growth Modeling: Towards a Fully Personalized Model?
Martens C, Rovai A, Bonatto D, Metens T, Debeir O, Decaestecker C, Goldman S, Van Simaeys G. Martens C, et al. Cancers (Basel). 2022 May 20;14(10):2530. doi: 10.3390/cancers14102530. Cancers (Basel). 2022. PMID: 35626134 Free PMC article. - Improving personalized tumor growth predictions using a Bayesian combination of mechanistic modeling and machine learning.
Mascheroni P, Savvopoulos S, Alfonso JCL, Meyer-Hermann M, Hatzikirou H. Mascheroni P, et al. Commun Med (Lond). 2021 Jul 29;1:19. doi: 10.1038/s43856-021-00020-4. eCollection 2021. Commun Med (Lond). 2021. PMID: 35602187 Free PMC article. - Radio-Pathomic Maps of Cell Density Identify Brain Tumor Invasion beyond Traditional MRI-Defined Margins.
Bobholz SA, Lowman AK, Brehler M, Kyereme F, Duenweg SR, Sherman J, McGarry SD, Cochran EJ, Connelly J, Mueller WM, Agarwal M, Banerjee A, LaViolette PS. Bobholz SA, et al. AJNR Am J Neuroradiol. 2022 May;43(5):682-688. doi: 10.3174/ajnr.A7477. Epub 2022 Apr 14. AJNR Am J Neuroradiol. 2022. PMID: 35422419 Free PMC article.
References
- Blinkov S. M., Glezer I. I. (1968). The Human Brain in Figures and Tables: A Quantitative Handbook. New York: Basic Books
LinkOut - more resources
Full Text Sources
Other Literature Sources


