The immunologic effects of maraviroc intensification in treated HIV-infected individuals with incomplete CD4+ T-cell recovery: a randomized trial - PubMed (original) (raw)
Randomized Controlled Trial
. 2013 Jun 6;121(23):4635-46.
doi: 10.1182/blood-2012-06-436345. Epub 2013 Apr 15.
Nancy S Shulman, Timothy L Hayes, Viktor Dahl, Ma Somsouk, Nicholas T Funderburg, Bridget McLaughlin, Alan L Landay, Oluwatoyin Adeyemi, Lee E Gilman, Brian Clagett, Benigno Rodriguez, Jeffrey N Martin, Timothy W Schacker, Barbara L Shacklett, Sarah Palmer, Michael M Lederman, Steven G Deeks
Affiliations
- PMID: 23589670
- PMCID: PMC3685899
- DOI: 10.1182/blood-2012-06-436345
Randomized Controlled Trial
The immunologic effects of maraviroc intensification in treated HIV-infected individuals with incomplete CD4+ T-cell recovery: a randomized trial
Peter W Hunt et al. Blood. 2013.
Abstract
The CCR5 inhibitor maraviroc has been hypothesized to decrease T-cell activation in HIV-infected individuals, but its independent immunologic effects have not been established in a placebo-controlled trial. We randomized 45 HIV-infected subjects with CD4 counts <350 cells per mm(3) and plasma HIV RNA levels <48 copies per mL on antiretroviral therapy (ART) to add maraviroc vs placebo to their regimen for 24 weeks followed by 12 weeks on ART alone. Compared with placebo-treated subjects, maraviroc-treated subjects unexpectedly experienced a greater median increase in % CD38+HLA-DR+ peripheral blood CD8+ T cells at week 24 (+2.2% vs -0.7%, P = .014), and less of a decline in activated CD4+ T cells (P < .001). The % CD38+HLA-DR+ CD4+ and CD8+ T cells increased nearly twofold in rectal tissue (both P < .001), and plasma CC chemokine receptor type 5 (CCR5) ligand (macrophage-inflammatory protein 1β) levels increased 2.4-fold during maraviroc intensification (P < .001). During maraviroc intensification, plasma lipopolysaccharide declined, whereas sCD14 levels and neutrophils tended to increase in blood and rectal tissue. Although the mechanisms explaining these findings remain unclear, CCR5 ligand-mediated activation of T cells, macrophages, and neutrophils via alternative chemokine receptors should be explored. These results may have relevance for trials of maraviroc for HIV preexposure prophylaxis and graft-versus-host disease. This trial was registered at www.clinicaltrials.gov as #NCT00735072.
Figures
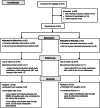
Figure 1
Enrollment, allocation, and follow-up for trial subjects. The outcomes of the 67 screened subjects are described in the Consolidated Standards of Reporting Trials (CONSORT) flow diagram.
Figure 2
Changes in low-level viremia during maraviroc intensification. Changes in low-level viremia (by SCA) were assessed with linear mixed models for maraviroc-treated (red) and placebo-treated (blue) subjects. Undetectable values were assigned a value equal to the lowest limit of detection for the assay. Estimated mean levels at each time point are plotted with 95% CIs. Mean changes over each indicated interval are also compared both within and between each arm, with P values provided for each comparison.
Figure 3
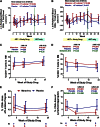
Changes in CD4+ and CD8+ T-cell counts in peripheral blood and rectal tissue during maraviroc intensification. Median changes from baseline in peripheral blood CD4+ (A) and CD8+ (B) T-cell counts are plotted over time for maraviroc-treated (red) and placebo-treated (blue) subjects. Vertical error bars represent IQR at each time point. The mean slopes of change over the indicated intervals (with P values) are also reported. Estimated mean changes (with 95% CI) in % CD4+ (C) and % CD8+ (D) T cells in rectal tissue (by flow cytometry on extracted cells), as well as the % CD4+ area (by immunohistochemistry) in both the lamina propria (E) and lymphoid aggregates (F) of rectal tissue, are also plotted over time for maraviroc-treated (red) and placebo-treated (blue) subjects. P values are provided for the changes within each indicated interval both within arms and between arms. Because only a subset of subjects had baseline rectal tissue with adequate representation of lamina propria and lymphoid aggregates, the number of subjects contributing to each time point is noted below the figure.
Figure 4
Changes in peripheral blood and rectal T-cell activation during maraviroc intensification. Estimated mean changes (with 95% CI) in the frequency of activated (CD38+HLA-DR+) CD4+ (A) and CD8+ (B) T cells in peripheral blood are plotted for placebo-treated (blue) and maraviroc-treated (red) subjects. Estimated mean changes (with 95% CI) in the frequency of activated CD4+ (C) and CD8+ (D) T cells in rectal tissue are also plotted for both arms. P values are provided for the changes within each indicated interval both within arms and between arms.
Figure 5
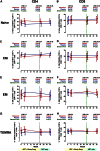
Changes in the frequencies of T-cell maturational phenotypes during maraviroc intensification. Estimated mean changes in naive (CD45RA+CCR7+) (A-B), central memory (CD45RA–CCR7+) (C-D), effector memory (CD45RA–CCR7–) (E-F), and terminally differentiated effector memory (TEMRA) (CD45RA+CCR7–) (G-H) CD4+ (A,C,E,G) and CD8+ (B,D,F,H) T-cell frequencies in peripheral blood (with 95% CI) are plotted for maraviroc-treated (red) and placebo-treated (blue) subjects over time. P values are provided for the changes within each indicated interval both within arms and between arms.
Figure 6
Changes in the frequency of CCR5+ T cells and plasma MIP-1β levels during maraviroc intensification. Changes in the % CCR5+ CD8+ T cells (A) and CD4+ T cells (B) in peripheral blood, the % CCR5+ CD4+ T cells in rectal tissue (C), and plasma levels of the CCR5 ligand MIP-1β (D) were assessed in placebo-treated (blue) and maraviroc-treated (red) subjects with linear mixed models. Estimated mean values are plotted over time with 95% CIs. P values are provided for the changes within each indicated interval both within arms and between arms.
Figure 7
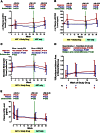
Changes in monocyte activation, neutrophil levels, and plasma LPS levels during maraviroc intensification. Changes in plasma sCD14 (A), sCD163 levels (B), peripheral blood absolute neutrophil counts (C), rectal tissue myeloperoxidase density (a surrogate marker for neutrophil density) (D), and plasma LPS levels (E) are plotted over time for both maraviroc-treated (red) and placebo-treated subjects (blue). Mean changes from baseline (A-B) or estimated mean values (C-E) with 95% CI from linear mixed models are plotted. P values are provided for the changes within each indicated interval both within arms and between arms. Given more frequent observations, changes in peripheral blood neutrophil counts were modeled as a linear spline with a change point at week 24.
Comment in
- Maraviroc-induced decrease in circulating bacterial products is not linked to an increase in immune activation in HIV-infected individuals.
Psomas C, Lavigne JP, Barbuat C, Trabelsi S, Ghosn J, Lascoux-Combe C, Flandre P, Cuzin L, Reynes J, Autran B, Corbeau P. Psomas C, et al. Blood. 2013 Sep 26;122(13):2282-3. doi: 10.1182/blood-2013-06-507012. Blood. 2013. PMID: 24072848 No abstract available. - Response: Maraviroc intensification and microbial translocation.
Hunt PW, Lederman MM, Deeks SG. Hunt PW, et al. Blood. 2013 Sep 26;122(13):2283-4. doi: 10.1182/blood-2013-08-516930. Blood. 2013. PMID: 24072849 No abstract available.
Similar articles
- Maraviroc Intensification of cART in Patients with Suboptimal Immunological Recovery: A 48-Week, Placebo-Controlled Randomized Trial.
van Lelyveld SF, Drylewicz J, Krikke M, Veel EM, Otto SA, Richter C, Soetekouw R, Prins JM, Brinkman K, Mulder JW, Kroon F, Middel A, Symons J, Wensing AM, Nijhuis M, Borghans JA, Tesselaar K, Hoepelman AI; MIRS study group. van Lelyveld SF, et al. PLoS One. 2015 Jul 24;10(7):e0132430. doi: 10.1371/journal.pone.0132430. eCollection 2015. PLoS One. 2015. PMID: 26208341 Free PMC article. Clinical Trial. - Maraviroc as intensification strategy in HIV-1 positive patients with deficient immunological response: an Italian randomized clinical trial.
Rusconi S, Vitiello P, Adorni F, Colella E, Focà E, Capetti A, Meraviglia P, Abeli C, Bonora S, D'Annunzio M, Di Biagio A, Di Pietro M, Butini L, Orofino G, Colafigli M, d'Ettorre G, Francisci D, Parruti G, Soria A, Buonomini AR, Tommasi C, Mosti S, Bai F, Di Nardo Stuppino S, Morosi M, Montano M, Tau P, Merlini E, Marchetti G. Rusconi S, et al. PLoS One. 2013 Nov 14;8(11):e80157. doi: 10.1371/journal.pone.0080157. eCollection 2013. PLoS One. 2013. PMID: 24244635 Free PMC article. Clinical Trial. - Intensification of antiretroviral therapy with a CCR5 antagonist in patients with chronic HIV-1 infection: effect on T cells latently infected.
Gutiérrez C, Díaz L, Vallejo A, Hernández-Novoa B, Abad M, Madrid N, Dahl V, Rubio R, Moreno AM, Dronda F, Casado JL, Navas E, Pérez-Elías MJ, Zamora J, Palmer S, Muñoz E, Muñoz-Fernández MÁ, Moreno S. Gutiérrez C, et al. PLoS One. 2011;6(12):e27864. doi: 10.1371/journal.pone.0027864. Epub 2011 Dec 8. PLoS One. 2011. PMID: 22174752 Free PMC article. Clinical Trial. - Clinical utility of maraviroc.
Parra J, Portilla J, Pulido F, Sánchez-de la Rosa R, Alonso-Villaverde C, Berenguer J, Blanco JL, Domingo P, Dronda F, Galera C, Gutiérrez F, Kindelán JM, Knobel H, Leal M, López-Aldeguer J, Mariño A, Miralles C, Moltó J, Ortega E, Oteo JA. Parra J, et al. Clin Drug Investig. 2011;31(8):527-542. doi: 10.2165/11590700-000000000-00000. Clin Drug Investig. 2011. PMID: 21595497 Review. - Maraviroc: a review of its use in the management of CCR5-tropic HIV-1 infection.
Perry CM. Perry CM. Drugs. 2010 Jun 18;70(9):1189-213. doi: 10.2165/11203940-000000000-00000. Drugs. 2010. PMID: 20518583 Review.
Cited by
- CR5/CCL5 axis is linked to a poor outcome, and inhibition reduces metastasis in oral squamous cell carcinoma.
González-Arriagada WA, Coletta RD, Lozano-Burgos C, García C, Maripillán J, Alcayaga-Miranda F, Godínez-Pacheco B, Oyarce-Pezoa S, Martínez-Flores R, García IE. González-Arriagada WA, et al. J Cancer Res Clin Oncol. 2023 Dec;149(19):17335-17346. doi: 10.1007/s00432-023-05443-1. Epub 2023 Oct 13. J Cancer Res Clin Oncol. 2023. PMID: 37831273 - Targeting CCR5 as a Component of an HIV-1 Therapeutic Strategy.
Mohamed H, Gurrola T, Berman R, Collins M, Sariyer IK, Nonnemacher MR, Wigdahl B. Mohamed H, et al. Front Immunol. 2022 Jan 20;12:816515. doi: 10.3389/fimmu.2021.816515. eCollection 2021. Front Immunol. 2022. PMID: 35126374 Free PMC article. Review. - Identifying CCR5 coreceptor populations permissive for HIV-1 entry and productive infection: implications for in vivo studies.
Weichseldorfer M, Tagaya Y, Reitz M, DeVico AL, Latinovic OS. Weichseldorfer M, et al. J Transl Med. 2022 Jan 24;20(1):39. doi: 10.1186/s12967-022-03243-8. J Transl Med. 2022. PMID: 35073923 Free PMC article. - CCR5 Receptor Occupancy Analysis Reveals Increased Peripheral Blood CCR5+CD4+ T Cells Following Treatment With the Anti-CCR5 Antibody Leronlimab.
Chang XL, Wu HL, Webb GM, Tiwary M, Hughes C, Reed JS, Hwang J, Waytashek C, Boyle C, Pessoa C, Sylwester AW, Morrow D, Belica K, Fischer M, Kelly S, Pourhassan N, Bochart RM, Smedley J, Recknor CP, Hansen SG, Sacha JB. Chang XL, et al. Front Immunol. 2021 Nov 19;12:794638. doi: 10.3389/fimmu.2021.794638. eCollection 2021. Front Immunol. 2021. PMID: 34868084 Free PMC article. Clinical Trial. - Blockade of Autocrine CCL5 Responses Inhibits Zika Virus Persistence and Spread in Human Brain Microvascular Endothelial Cells.
Mladinich MC, Conde JN, Schutt WR, Sohn SY, Mackow ER. Mladinich MC, et al. mBio. 2021 Aug 31;12(4):e0196221. doi: 10.1128/mBio.01962-21. Epub 2021 Aug 17. mBio. 2021. PMID: 34399621 Free PMC article.
References
- Deeks SG, Phillips AN. HIV infection, antiretroviral treatment, ageing, and non-AIDS related morbidity. BMJ. 2009;338:a3172. - PubMed
- Lohse N, Hansen AB, Pedersen G, et al. Survival of persons with and without HIV infection in Denmark, 1995-2005. Ann Intern Med. 2007;146(2):87–95. - PubMed
- Lewden C, Chene G, Morlat P, et al. Agence Nationale de Recherches sur le Sida et les Hepatites Virales (ANRS) CO8 APROCO-COPILOTE Study Group; Agence Nationale de Recherches sur le Sida et les Hepatites Virales (ANRS) CO3 AQUITAINE Study Group. HIV-infected adults with a CD4 cell count greater than 500 cells/mm3 on long-term combination antiretroviral therapy reach same mortality rates as the general population. J Acquir Immune Defic Syndr. 2007;46(1):72–77. - PubMed
- Hunt PW, Martin JN, Sinclair E, et al. T cell activation is associated with lower CD4+ T cell gains in human immunodeficiency virus-infected patients with sustained viral suppression during antiretroviral therapy. J Infect Dis. 2003;187(10):1534–1543. - PubMed
Publication types
MeSH terms
Substances
Grants and funding
- AI36219/AI/NIAID NIH HHS/United States
- K23 CA157929/CA/NCI NIH HHS/United States
- UL1 RR024131/RR/NCRR NIH HHS/United States
- P30AI08215/AI/NIAID NIH HHS/United States
- AI087035/AI/NIAID NIH HHS/United States
- P01 AI076174/AI/NIAID NIH HHS/United States
- R21 AI087035/AI/NIAID NIH HHS/United States
- CA157929/CA/NCI NIH HHS/United States
- P30 AI027763/AI/NIAID NIH HHS/United States
- R01 AI057020/AI/NIAID NIH HHS/United States
- P30 AI27763/AI/NIAID NIH HHS/United States
- AI057020/AI/NIAID NIH HHS/United States
- P30 AI036219/AI/NIAID NIH HHS/United States
- K99 HL108743/HL/NHLBI NIH HHS/United States
LinkOut - more resources
Full Text Sources
Other Literature Sources
Medical
Research Materials


