DNA deaminases induce break-associated mutation showers with implication of APOBEC3B and 3A in breast cancer kataegis - PubMed (original) (raw)
DNA deaminases induce break-associated mutation showers with implication of APOBEC3B and 3A in breast cancer kataegis
Benjamin Jm Taylor et al. Elife. 2013.
Abstract
Breast cancer genomes have revealed a novel form of mutation showers (kataegis) in which multiple same-strand substitutions at C:G pairs spaced one to several hundred nucleotides apart are clustered over kilobase-sized regions, often associated with sites of DNA rearrangement. We show kataegis can result from AID/APOBEC-catalysed cytidine deamination in the vicinity of DNA breaks, likely through action on single-stranded DNA exposed during resection. Cancer-like kataegis can be recapitulated by expression of AID/APOBEC family deaminases in yeast where it largely depends on uracil excision, which generates an abasic site for strand breakage. Localized kataegis can also be nucleated by an I-SceI-induced break. Genome-wide patterns of APOBEC3-catalyzed deamination in yeast reveal APOBEC3B and 3A as the deaminases whose mutational signatures are most similar to those of breast cancer kataegic mutations. Together with expression and functional assays, the results implicate APOBEC3B/A in breast cancer hypermutation and give insight into the mechanism of kataegis. DOI:http://dx.doi.org/10.7554/eLife.00534.001.
Keywords: AID/APOBECs; Cancer; Cytidine deamination; DNA deamination; Human; Hypermutation; Kataegis; S. cerevisiae.
Conflict of interest statement
The authors declare that no competing interests exist.
Figures
Figure 1.. AID/APOBEC-induced kataegis in yeast.
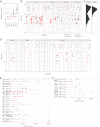
(A) The total number of mutations detected in canavanine-resistant (CanR) AID/APOBEC yeast transformants, median frequency indicated. (B) Rainfall plot of genome-wide intermutational distances (IMD) in individual CanR AID* transformants. Clone identifier is indicated along the top, mutations shown as dots with the y-axis giving the distance to the next downstream mutation on the same chromosome. For each clone, dots are ordered sequentially along the genome. Dot colours represent: cluster mutations (at C, red; G, black), unclustered mutations (at C, pink; G, grey). Mutations at A:T (14 out of 1078 total), single mutations on individual chromosomes (15% of the database), the most downstream mutation in each chromosome and transformants without any multiply mutated chromosomes (5/40) are not depicted. Supplementary file 1B contains the location of all identified mutations. (C) Observed distribution of IMDs in the AID* dataset compared to a simulation assuming mutations are randomly scattered throughout the genome. (D) IMD plots of APOBEC3A/B/G*-expressing yeast transformants (28/78 transformants harboured no multiply mutated chromosome and are not depicted). (E) Detailed view of AID* mutation clusters. Each line represents an individual cluster with the clone identifier (grey box), number of mutations in the cluster and total mutations in the clone indicated. Mutations are coloured as in (B), a horizontal line indicates mutations that have coalesced, * indicates clusters localising within 10 kb of CAN1. All clusters containing ≥5 mutations are depicted. (F) Mutation clusters identified in yeast APOBEC3 transformants. DOI:
http://dx.doi.org/10.7554/eLife.00534.003
Figure 1—figure supplement 1.. Characterisation of AID/APOBEC yeast transformants.
(A) CanR frequencies of yeast transformants expressing different AID/APOBEC proteins. (B) AID/APOBEC protein levels in yeast transformants. Whole cell extracts from 24 hr galactose induced yeast transformants were immunoblotted with anti-FLAG (M2; Sigma) and anti-β-Actin (ab8224; Abcam). DOI:
http://dx.doi.org/10.7554/eLife.00534.004
Figure 2.. Yeast kataegic clusters are associated with transversions, are reduced by UNG-deficiency and can be triggered by a double strand DNA break.
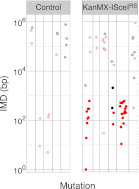
(A) IMD plots of AID*/APOBEC transformants reveal preferential association of nucleotide transversions with kataegic clusters. Mutation datasets and presentation are as in Figure 1B but with transition mutations represented by yellow dots and transversions by blue dots. Density plots depict the overall distribution of transition (Tn) and transversion (Tv) mutations at C:G pairs. (B) IMD plots of AID*/APOBEC-expressing _ung1_Δ yeast transformants, depicted as in Figure 2A. Density plots compare the distributions of IMDs in AID* transformants of _ung1_Δ and wild type yeast. (C) All mutation clusters identified in AID*/APOBEC3A-transformants of _ung1_Δ yeast depicted as in Figure 1E. (D) Kataegis localised to a double strand break. Mutations in the vicinity of the CAN1 locus of (I-SceI+APOBEC3G*) transformants of either control cells or of a KanMX-ISceIRS derivative carrying a _CAN1_-proximal I-SceI recognition sequence. The I-SceI cut site is marked with an arrow. All CAN1 mutations in control cells and 33/36 CAN1 region mutations in KanMX-ISceIRS cells occur at the canonical APOBEC3G _C_C context. Two-thirds of the CAN1 region mutations in the KanMX-ISceIRS cells were transversions. DOI:
http://dx.doi.org/10.7554/eLife.00534.005
Figure 2—figure supplement 1.. Canavanine resistance frequencies of yeast transformants carrying an I-SceI recognition sequence (I-SceIRS).
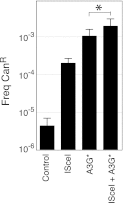
CanR mutation frequency of yeast cells carrying an I-SceIRS 420 bp downstream of the CAN1 polyadenylation site (KanMX-ISceIRS cells) which have been induced for APOBEC3G* and/or I-SceI expression. * indicated p<0.05. DOI:
http://dx.doi.org/10.7554/eLife.00534.006
Figure 2—figure supplement 2.. IMD plots of mutations from CanR (I-SceI+APOBEC3G*) transformants of control or KanMX-ISceIRS cells IMD plots coloured as in Figure 1B.
DOI:
http://dx.doi.org/10.7554/eLife.00534.007
Figure 3.. Comparison of kataegic mutations in yeast AID/APOBEC transformants with those in breast cancers.
(A) Comparison of the length, number of mutations and polarity of yeast kataegic clusters with those in breast cancers. The degree of strand polarity is indicated by colour intensity. The breast cancer data (Nik-Zainal et al., 2012) are a compilation from three tumours (PD4103a, PD4107a, PD4199a) chosen for their large number of clusters. (B) Context of the genome wide mutated C bases in yeast AID/APOBEC transformants with total numbers of mutations in each dataset indicated. (C) Context of the kataegic and singlet mutated C bases in selected breast cancers. Analyses of all sequenced breast cancers are presented in Figure 3—figure supplements 2–4. (D) Similarity of sequence contexts of C mutations in breast cancer kataegic stretches compared to those of deaminase-induced C mutations in yeast. (D1) Identity of the base at the −2 position of _T_C mutations in cancer kataegic regions and in APOBEC3A/B yeast transformants. The base compositions were normalised to the genomic base composition of the −2 base at _T_C dinucleotides. (D2) Sequence contexts similarity p-value at positions (−1 plus −2) to the mutated Cs. The contexts of all Cs throughout the yeast and human genomes are included for comparison. Mutation context of wild type versions of AID and APOBEC3G are shown in Figure 3—figure supplement 1. Analysis of additional yeast transformants and breast cancers is shown in Figure 3—figure supplements 2–4. DOI:
http://dx.doi.org/10.7554/eLife.00534.009
Figure 3—figure supplement 1.. Mutation context of hyperactive APOBEC3G and AID are identical to the wild type proteins.
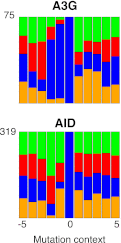
Mutation context of CanR transformants expressing APOBEC3G and AID. DOI:
http://dx.doi.org/10.7554/eLife.00534.010
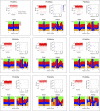
Figure 3—figure supplement 2.. Analysis of kataegic stretches and mutation distributions of 21 breast cancers.
Analysis of tumours PD3851a to PD4086a. For each tumour, somatic mutations are displayed as intermutational distance (IMD) plots (top left), as described in Figure 1B. Dots are coloured according to kataegic mutations (black) or singlet mutations (red). The sequence context of C mutations in unclustered and kataegic locations are shown (lower plots), with the number of mutations indicated, coloured as in Figure 3B. The length and number of mutations within each cluster is displayed (top right), with the dot colour intensity indicating polarity. Data are taken from Nik-Zainal et al. (2012). DOI:
http://dx.doi.org/10.7554/eLife.00534.011
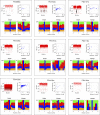
Figure 3—figure supplement 3.. Analysis of kataegic stretches and mutation distributions of 21 breast cancers.
Analysis of tumours PD4088a to PD4194a. For each tumour, somatic mutations are displayed as intermutational distance (IMD) plots (top left), as described in Figure 1B. Dots are coloured according to kataegic mutations (black) or singlet mutations (red). The sequence context of C mutations in unclustered and kataegic locations are shown (lower plots), with the number of mutations indicated, coloured as in Figure 3B. The length and number of mutations within each cluster is displayed (top right), with the dot colour intensity indicating polarity. Data are taken from Nik-Zainal et al. (2012). DOI:
http://dx.doi.org/10.7554/eLife.00534.012
Figure 3—figure supplement 4.. Analysis of kataegic stretches and mutation distributions of 21 breast cancers.
Analysis of tumours PD4198a to PD4248a. For each tumour, somatic mutations are displayed as intermutational distance (IMD) plots (top left), as described in Figure 1B. Dots are coloured according to kataegic mutations (black) or singlet mutations (red). The sequence context of C mutations in unclustered and kataegic locations are shown (lower plots), with the number of mutations indicated, coloured as in Figure 3B. The length and number of mutations within each cluster is displayed (top right), with the dot colour intensity indicating polarity. Data are taken from Nik-Zainal et al. (2012). DOI:
http://dx.doi.org/10.7554/eLife.00534.013
Figure 4.. DNA damage by APOBEC3 family members and expression in breast cancer cell-lines.
(A) Effect of enforced APOBEC expression on cell viability. (A1) Stable transfectants of KBM7 cells that inducibly express APOBEC proteins were incubated with inducer (doxycyclin) and viability was monitored after 72 hr. (A2) Expression of FLAG-tagged APOBECs after 24 hr doxycyclin treatment. (B) Enforced expression of APOBEC3A and APOBEC3B leads to induction of histone γH2AX and of 53BP1 foci. The percentage of cells (B1) positive for histone γH2AX expression quantified by flow cytometry and (B2) exhibiting punctate rather than diffuse 53BP1 staining quantified by immunofluorescence microscopy, with the foci number per cell indicated. (C) Expression of APOBEC family members in six human breast cancer cell-lines as well as in HEK293 cells was analysed by qRT-PCR of total cellular RNA. Expression is shown relative to the average of housekeeping genes HPRT and HMBS. The effect of phorbol ester (PMA) and interferon alpha (INFα) treatment on APOBEC3A and APOBEC3B levels is also shown. In all cases, * indicates p<0.1, ** indicates p<0.0001 compared to control (unpaired t-test). DOI:
http://dx.doi.org/10.7554/eLife.00534.014
Similar articles
- AID/APOBEC cytosine deaminase induces genome-wide kataegis.
Lada AG, Dhar A, Boissy RJ, Hirano M, Rubel AA, Rogozin IB, Pavlov YI. Lada AG, et al. Biol Direct. 2012 Dec 18;7:47; discussion 47. doi: 10.1186/1745-6150-7-47. Biol Direct. 2012. PMID: 23249472 Free PMC article. - Association of a germline copy number polymorphism of APOBEC3A and APOBEC3B with burden of putative APOBEC-dependent mutations in breast cancer.
Nik-Zainal S, Wedge DC, Alexandrov LB, Petljak M, Butler AP, Bolli N, Davies HR, Knappskog S, Martin S, Papaemmanuil E, Ramakrishna M, Shlien A, Simonic I, Xue Y, Tyler-Smith C, Campbell PJ, Stratton MR. Nik-Zainal S, et al. Nat Genet. 2014 May;46(5):487-91. doi: 10.1038/ng.2955. Epub 2014 Apr 13. Nat Genet. 2014. PMID: 24728294 Free PMC article. - APOBEC3 cytidine deaminases in double-strand DNA break repair and cancer promotion.
Nowarski R, Kotler M. Nowarski R, et al. Cancer Res. 2013 Jun 15;73(12):3494-8. doi: 10.1158/0008-5472.CAN-13-0728. Epub 2013 Apr 18. Cancer Res. 2013. PMID: 23598277 Free PMC article. - Molecular mechanism and clinical impact of APOBEC3B-catalyzed mutagenesis in breast cancer.
Harris RS. Harris RS. Breast Cancer Res. 2015 Jan 21;17(1):8. doi: 10.1186/s13058-014-0498-3. Breast Cancer Res. 2015. PMID: 25848704 Free PMC article. Review. - Error-free versus mutagenic processing of genomic uracil--relevance to cancer.
Krokan HE, Sætrom P, Aas PA, Pettersen HS, Kavli B, Slupphaug G. Krokan HE, et al. DNA Repair (Amst). 2014 Jul;19:38-47. doi: 10.1016/j.dnarep.2014.03.028. Epub 2014 Apr 18. DNA Repair (Amst). 2014. PMID: 24746924 Review.
Cited by
- RNA-seq and whole-genome re-sequencing reveal Micropterus salmoides growth-linked gene and selection signatures under carbohydrate-rich diet and varying temperature.
Lei C, Song H, Song H, Zhu T, Du J, Li S. Lei C, et al. Sci Rep. 2024 Oct 24;14(1):25184. doi: 10.1038/s41598-024-76685-3. Sci Rep. 2024. PMID: 39448759 Free PMC article. - Widespread mutagenesis and chromosomal instability shape somatic genomes in systemic sclerosis.
Vijayraghavan S, Blouin T, McCollum J, Porcher L, Virard F, Zavadil J, Feghali-Bostwick C, Saini N. Vijayraghavan S, et al. Nat Commun. 2024 Oct 15;15(1):8889. doi: 10.1038/s41467-024-53332-z. Nat Commun. 2024. PMID: 39406724 Free PMC article. - Characterisation of APOBEC3B-Mediated RNA editing in breast cancer cells reveals regulatory roles of NEAT1 and MALAT1 lncRNAs.
Zhang C, Lu YJ, Wang M, Chen B, Xiong F, Mitsopoulos C, Rossanese O, Li X, Clarke PA. Zhang C, et al. Oncogene. 2024 Sep 25. doi: 10.1038/s41388-024-03171-5. Online ahead of print. Oncogene. 2024. PMID: 39322638 - Hypomorphic mutation in the large subunit of replication protein A affects mutagenesis by human APOBEC cytidine deaminases in yeast.
Dennen MS, Kockler ZW, Roberts SA, Burkholder AB, Klimczak LJ, Gordenin DA. Dennen MS, et al. G3 (Bethesda). 2024 Oct 7;14(10):jkae196. doi: 10.1093/g3journal/jkae196. G3 (Bethesda). 2024. PMID: 39150943 Free PMC article. - Regulation, functional impact, and therapeutic targeting of APOBEC3A in cancer.
Kawale AS, Zou L. Kawale AS, et al. DNA Repair (Amst). 2024 Sep;141:103734. doi: 10.1016/j.dnarep.2024.103734. Epub 2024 Jul 20. DNA Repair (Amst). 2024. PMID: 39047499 Review.
References
Publication types
MeSH terms
Substances
Grants and funding
- U105178806/MRC_/Medical Research Council/United Kingdom
- MC_U105178806/MRC_/Medical Research Council/United Kingdom
- 098051/WT_/Wellcome Trust/United Kingdom
- WT_/Wellcome Trust/United Kingdom
- F32 AI091311/AI/NIAID NIH HHS/United States
- 088340/WT_/Wellcome Trust/United Kingdom
LinkOut - more resources
Full Text Sources
Other Literature Sources
Medical
