Estimating variable effective population sizes from multiple genomes: a sequentially markov conditional sampling distribution approach - PubMed (original) (raw)
Estimating variable effective population sizes from multiple genomes: a sequentially markov conditional sampling distribution approach
Sara Sheehan et al. Genetics. 2013 Jul.
Abstract
Throughout history, the population size of modern humans has varied considerably due to changes in environment, culture, and technology. More accurate estimates of population size changes, and when they occurred, should provide a clearer picture of human colonization history and help remove confounding effects from natural selection inference. Demography influences the pattern of genetic variation in a population, and thus genomic data of multiple individuals sampled from one or more present-day populations contain valuable information about the past demographic history. Recently, Li and Durbin developed a coalescent-based hidden Markov model, called the pairwise sequentially Markovian coalescent (PSMC), for a pair of chromosomes (or one diploid individual) to estimate past population sizes. This is an efficient, useful approach, but its accuracy in the very recent past is hampered by the fact that, because of the small sample size, only few coalescence events occur in that period. Multiple genomes from the same population contain more information about the recent past, but are also more computationally challenging to study jointly in a coalescent framework. Here, we present a new coalescent-based method that can efficiently infer population size changes from multiple genomes, providing access to a new store of information about the recent past. Our work generalizes the recently developed sequentially Markov conditional sampling distribution framework, which provides an accurate approximation of the probability of observing a newly sampled haplotype given a set of previously sampled haplotypes. Simulation results demonstrate that we can accurately reconstruct the true population histories, with a significant improvement over the PSMC in the recent past. We apply our method, called diCal, to the genomes of multiple human individuals of European and African ancestry to obtain a detailed population size change history during recent times.
Keywords: hidden Markov model (HMM); population size; recombination; sequentially Markov coalescent.
Figures
Figure 1
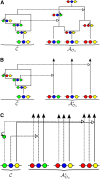
Illustration of a conditional genealogy C for a three-locus model. The three loci of a haplotype are each represented by a solid circle, with the color indicating the allelic type at that locus. Mutation events, along with the locus and resulting haplotype, are indicated by small arrows. Recombination events, and the resulting haplotype, are indicated by branching events. Absorption events are indicated by dotted horizontal lines. (A) The true genealogy AOn for the already observed sample O_n_. (B) Approximation by the trunk genealogy AOn*. Lineages in the trunk do not mutate, recombine, or coalesce. (C) Marginal conditional genealogy for each locus.
Figure 2
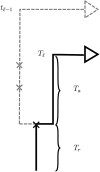
Illustration of the sequentially Markov approximation in which the absorption time _T_ℓ at locus ℓ is sampled conditionally on the absorption time _T_ℓ−1 = _t_ℓ−1 at the previous locus. In the marginal conditional genealogy Cℓ−1 for locus ℓ − 1, recombination breakpoints are realized as a Poisson process with rate ρ(ℓ−1,ℓ). If no recombination occurs, Cℓ is identical to Cℓ−1. If recombination does occur, as in the example here, Cℓ is identical to Cℓ−1 up to the time _T_r of the most recent recombination event. At this point, the lineage at locus ℓ, independently of the lineage at locus ℓ − 1, proceeds backward in time until being absorbed into a lineage of the trunk. The absorption time at locus ℓ is _T_ℓ = _T_r + _T_a, where _T_a is the remaining absorption time after the recombination event.
Figure 3
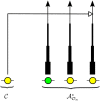
Illustration of the wedding-cake genealogy approximation, in which the varying thickness of a lineage in AOn* schematically represents the amount of contribution to the absorption rate. As shown, the wedding-cake genealogy never actually loses any of the n lineages, and absorption into any of the n lineages is allowed at all times; we are modifying the absorption rate only as a function of time.
Figure 4
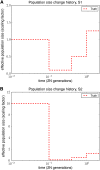
Population size histories considered in our simulation study, with time t = 0 corresponding to the present. (A) History S1 containing a bottleneck. (B) History S2 containing a bottleneck followed by a rapid expansion.
Figure 5
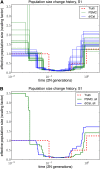
Results of PSMC and diCal on data sets simulated under history S1 with sample size n = 10 and four alleles (A, C, G, and T). PSMC significantly overestimates the most recent population size, whereas we obtain good estimates up until the very ancient past. (A) Results for 10 different data sets. (B) Average over the 10 data sets.
Figure 6
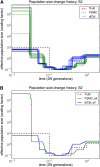
Results of PSMC and diCal on data sets simulated under history S2 with sample size n = 10 and four alleles (A, C, G, and T). The PSMC shows runaway behavior during the recent past, overestimating the most recent time by over three orders of magnitude on average. (A) Results for 10 different data sets. (B) Average over the 10 data sets.
Figure 7
The effect of considering more haplotypes in diCal, using the SMCSD-based leave-one-out likelihood approach. Data were simulated under population size history S1 with two alleles. In this study, we grouped adjacent parameters to fit roughly with population size change points for illustration purposes. Shown is the increase in the accuracy of our method with an increasing sample size n. The recent sizes are the most dramatically affected, while intermediate sizes remain accurate even with few haplotypes.
Figure 8
A comparison of the SMCSD-based leave-one-out likelihood approach in diCal, using the wedding-cake genealogy (blue line), with that using the unmodified trunk genealogy (green line). The results shown are for n = 10 haplotypes simulated under history S1 with two alleles. Without the wedding-cake genealogy, absorption of the left-out lineage into the trunk occurs too quickly, and the lack of absorption events in the midpast to the ancient past leads to substantial overestimation of the population sizes. Recent population sizes remain unaffected since during these times the absorption rates in the wedding-cake genealogy and in the trunk genealogy are roughly the same. In this example, we grouped adjacent parameters to fit roughly with population size change points for illustration purposes.
Figure 9
Estimated absorption times in diCal using the leave-one-out SMCSD method vs. the true coalescence times for a 100-kb region. The data were simulated using ms for n = 6 haplotypes, assuming a constant population size. The true coalescence time at each site, obtained from ms, was taken as the time the ancestral lineage of a left-out haplotype joined the rest of the coalescent tree at that site. Shown is the true coalescence time for the _n_th haplotype and our corresponding inferred absorption times, obtained from the posterior decoding and the posterior mean. Our estimates generally track the true coalescence times closely.
Figure 10
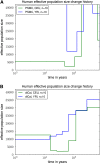
Variable effective population size inferred from real human data for European (CEU) and African (YRI) populations. For each population, we analyzed a 2-Mb region on chromosome 1 from five diploid individuals (10 haplotypes), assuming a per-generation mutation rate of μ = 1.25 × 10⁻⁸ per site. (A) The results of PSMC, which had some runaway behavior and unrealistic results. The data set is probably too small for PSMC to work accurately. (B) The results of diCal. We inferred that the European population size underwent a severe bottleneck ∼117 KYA and recovered in the past 16,000 years to an effective size of ≈12,500. In contrast, our results suggest that the YRI population size did not experience such a significant drop during the early out-of-Africa bottleneck phase in Europeans.
Similar articles
- An accurate sequentially Markov conditional sampling distribution for the coalescent with recombination.
Paul JS, Steinrücken M, Song YS. Paul JS, et al. Genetics. 2011 Apr;187(4):1115-28. doi: 10.1534/genetics.110.125534. Epub 2011 Jan 26. Genetics. 2011. PMID: 21270390 Free PMC article. - Robust inference of population size histories from genomic sequencing data.
Upadhya G, Steinrücken M. Upadhya G, et al. PLoS Comput Biol. 2022 Sep 16;18(9):e1010419. doi: 10.1371/journal.pcbi.1010419. eCollection 2022 Sep. PLoS Comput Biol. 2022. PMID: 36112715 Free PMC article. - Inferring demography from runs of homozygosity in whole-genome sequence, with correction for sequence errors.
MacLeod IM, Larkin DM, Lewin HA, Hayes BJ, Goddard ME. MacLeod IM, et al. Mol Biol Evol. 2013 Sep;30(9):2209-23. doi: 10.1093/molbev/mst125. Epub 2013 Jul 10. Mol Biol Evol. 2013. PMID: 23842528 Free PMC article. - A practical introduction to sequentially Markovian coalescent methods for estimating demographic history from genomic data.
Mather N, Traves SM, Ho SYW. Mather N, et al. Ecol Evol. 2019 Dec 7;10(1):579-589. doi: 10.1002/ece3.5888. eCollection 2020 Jan. Ecol Evol. 2019. PMID: 31988743 Free PMC article. Review. - Ancestral Population Genomics.
Dutheil JY, Hobolth A. Dutheil JY, et al. Methods Mol Biol. 2019;1910:555-589. doi: 10.1007/978-1-4939-9074-0_18. Methods Mol Biol. 2019. PMID: 31278677 Review.
Cited by
- Efficient ancestry and mutation simulation with msprime 1.0.
Baumdicker F, Bisschop G, Goldstein D, Gower G, Ragsdale AP, Tsambos G, Zhu S, Eldon B, Ellerman EC, Galloway JG, Gladstein AL, Gorjanc G, Guo B, Jeffery B, Kretzschumar WW, Lohse K, Matschiner M, Nelson D, Pope NS, Quinto-Cortés CD, Rodrigues MF, Saunack K, Sellinger T, Thornton K, van Kemenade H, Wohns AW, Wong Y, Gravel S, Kern AD, Koskela J, Ralph PL, Kelleher J. Baumdicker F, et al. Genetics. 2022 Mar 3;220(3):iyab229. doi: 10.1093/genetics/iyab229. Genetics. 2022. PMID: 34897427 Free PMC article. - An ethnically relevant consensus Korean reference genome is a step towards personal reference genomes.
Cho YS, Kim H, Kim HM, Jho S, Jun J, Lee YJ, Chae KS, Kim CG, Kim S, Eriksson A, Edwards JS, Lee S, Kim BC, Manica A, Oh TK, Church GM, Bhak J. Cho YS, et al. Nat Commun. 2016 Nov 24;7:13637. doi: 10.1038/ncomms13637. Nat Commun. 2016. PMID: 27882922 Free PMC article. - Biobank-scale inference of ancestral recombination graphs enables genealogical analysis of complex traits.
Zhang BC, Biddanda A, Gunnarsson ÁF, Cooper F, Palamara PF. Zhang BC, et al. Nat Genet. 2023 May;55(5):768-776. doi: 10.1038/s41588-023-01379-x. Epub 2023 May 1. Nat Genet. 2023. PMID: 37127670 Free PMC article. - Aberrant Time to Most Recent Common Ancestor as a Signature of Natural Selection.
Hunter-Zinck H, Clark AG. Hunter-Zinck H, et al. Mol Biol Evol. 2015 Oct;32(10):2784-97. doi: 10.1093/molbev/msv142. Epub 2015 Jun 20. Mol Biol Evol. 2015. PMID: 26093129 Free PMC article. - Identification of Selective Sweeps in the Domesticated Table and Wine Grape (Vitis vinifera L.).
Kui L, Tang M, Duan S, Wang S, Dong X. Kui L, et al. Front Plant Sci. 2020 May 14;11:572. doi: 10.3389/fpls.2020.00572. eCollection 2020. Front Plant Sci. 2020. PMID: 32477387 Free PMC article.
References
- Crawford D. C., Bhangale T., Li N., Hellenthal G., Rieder M. J., et al. , 2004. Evidence for substantial fine-scale variation in recombination rates across the human genome. Nat. Genet. 36: 700–706 - PubMed
Publication types
MeSH terms
LinkOut - more resources
Full Text Sources
Other Literature Sources
Miscellaneous
