DNA synthesis by Pol η promotes fragile site stability by preventing under-replicated DNA in mitosis - PubMed (original) (raw)
DNA synthesis by Pol η promotes fragile site stability by preventing under-replicated DNA in mitosis
Valérie Bergoglio et al. J Cell Biol. 2013.
Abstract
Human DNA polymerase η (Pol η) is best known for its role in responding to UV irradiation-induced genome damage. We have recently observed that Pol η is also required for the stability of common fragile sites (CFSs), whose rearrangements are considered a driving force of oncogenesis. Here, we explored the molecular mechanisms underlying this newly identified role. We demonstrated that Pol η accumulated at CFSs upon partial replication stress and could efficiently replicate non-B DNA sequences within CFSs. Pol η deficiency led to persistence of checkpoint-blind under-replicated CFS regions in mitosis, detectable as FANCD2-associated chromosomal sites that were transmitted to daughter cells in 53BP1-shielded nuclear bodies. Expression of a catalytically inactive mutant of Pol η increased replication fork stalling and activated the replication checkpoint. These data are consistent with the requirement of Pol η-dependent DNA synthesis during S phase at replication forks stalled in CFS regions to suppress CFS instability by preventing checkpoint-blind under-replicated DNA in mitosis.
Figures
Figure 1.
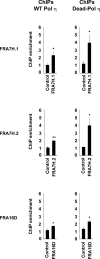
Pol η accumulates at CFSs after replication stress. U2OS cells stably expressing WT Pol η (left panels) or Dead-Pol η (right panels) were exposed to 0.2 µM APH for 24 h and analyzed by chromatin immunoprecipitation (ChIP) followed by quantitative PCR for accumulation of WT Pol η and Dead Pol η at the indicated CFSs (FRA7H.1, FRA7H.2, and FRA16D) or control genomic regions (DHFR, GAPDH). Fold increase of chromatin immunoprecipitation (ChIP) over input DNA was calculated as a ratio between mock and Pol η for each replicate. Data are presented as mean values of three independent experiments ± SEM. The statistical significance of Pol η enrichment at CFSs in comparison to DNA control region was assessed using t test. P-values for ChIPs were as follows: P = 0.033 for FRA7H.1; P = 0.004 for FRA7H.2; P = 0.048 for FRA16D (WT Pol η) and P = 0.030 for FRA7H.1; P = 0.023 for FRA7H.2; and P = 0.021 for FRA16D (Dead-Pol η).
Figure 2.
Comparison of Pol δ and Pol η pausing within FRA16D and FRA3B non-B DNA sequence elements. Primer extension reactions were performed as described in Materials and methods with 500 fmol-1 pmol human four-subunit Pol δ or 1 pmol human Pol η; in each panel is shown pausing gels for Pols δ and η (top) and quantification (bottom); black triangles represent 2-, 5-, and 15-min time points; −, no polymerase control; +, hybridization control; TACG, dideoxy sequencing ladder; horizontal lines indicate boundaries of CFS inserts. Sequences with predicted non-B DNA potential are outlined by brackets and annotated to the left of the gels. *, statistical significance (P < 0.05) between percent transit on the control template and template of interest for each Pol, determined by t test. #, statistical significance (P < 0.05) between normalized percent transit for Pol δ and η on the template of interest, determined by t test. Bars represent mean ± SD for three (Pol delta) or four (Pol eta) independent reactions. (A) Control CFS template; (B) FRA16D template 1; (C) FRA16D template 2; (D) FRA3B template. Pol δ and Pol η were assayed in parallel on the FRA3B template, so the same control samples and dideoxy sequencing ladder are shown for both in D.
Figure 3.
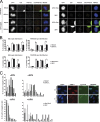
Pol η deficiency leads to DNA replication delay and persistence of under-replicated regions in mitosis and G1. (A and B) EdU incorporation and FANCD2 staining in untreated or APH-treated mitotic cells. (A) Representative images of DAPI (grayscale), EdU (grayscale), FANCD2 (grayscale), FANCD2 (red) + EdU (green) merged image, FANCD2 (red) + EdU (green) + DAPI (blue) merged image in mock-depleted and Pol η–depleted U2OS cells (left panels), XP30RO cell and XP30RO cells stably complemented with the WT Pol η (right panels). Bar, 10 µM. (B) Quantification of EdU and FANCD2 spot distribution in the indicated APH-treated mitotic cells as indicated in Materials and methods. The frequency of mitotic cells at prometaphase and metaphase presenting the indicated number of EdU or FANCD2 spots is reported. Error bars represent standard error. *, P < 0.05; **, P < 0.01 with the χ2 test. (C) Histograms: quantification of 53BP1 bodies in G1 nuclei from the indicated cell lines, untreated or treated with 0.2 µM APH. Cyclin A–negative cells were scored and classified in the indicated categories based on the number of 53BP1 nuclear bodies. The data shown are from a single representative experiment out of three repeats. For the experiment shown, n = 100; example of images of the 53BP1 bodies (red), cyclin A (green), and DAPI (blue) staining from APH-treated Pol η–depleted cells is shown on the right. Images were obtained from a microscope (63× objective, model DMLA; Leica). Bar, 10 µM.
Figure 4.
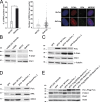
Analysis of the replication stress in Pol η–deficient cells and Dead Pol η–expressing cells. (A) Left and middle: mock-depleted (ShCtrl) and Pol η–depleted (ShPolη) U2OS cells were randomly acquired with wide-field microscopy (n > 70 cells) in three independent experiments. Quantification of RPA-positive nuclei (right) and number of RPA foci per nucleus (middle) was performed in PCNA foci–positive nuclei (S phase). For the quantification of RPA-positive cells, the p-value was determined with the t-test (*, P = 0.019; standard deviations are indicated by error bars. The number of RPA foci per nucleus was counted with ImageJ software (n = 234; National Institutes of Health). The p-value was determined with the non-parametric Mann-Whitney test (***, P < 0.005). Right: example of images from ShCtrl and ShPolη cells immunostained with anti PCNA (red), anti RPA (green), and DAPI (blue). Triton preextraction was performed before fixation. Bar, 10 µM. (B) Analysis of Chk1 phosphorylation in Pol η–depleted U2OS cells. Anti-Pol η, P-Chk1(ser 345), and Chk1 immunodetection on whole extracts from U2OS cells treated with UV (20J/m2, 6 h) as positive control for Chk1 phosphorylation, U2OS cells untreated and U2OS cells mock depleted (ShCtrl), or Pol η–depleted (ShPolη). Chk1 serves here as a loading control. (C) Extracts from XPV cells, XPV cells stably complemented with Pol η WT (XPV+Polη WT), or the Dead form of Pol η (XPV+Polη Dead1 and XPV+Polη Dead2) were fractionated and the soluble fractions were analyzed by immunoblotting for the detection of Pol η, P-Chk1(ser 345), Chk1, and α-tubulin as loading control. (D) The chromatin fraction from extracts described in C were analyzed by immunoblotting for RPA level into the chromatin. ORC2 was used as a loading and fractionation control. (E) Requirement of PIP and UBZ domains of Dead Pol η for its ability to activate the replication checkpoint. Extracts from XPV cells, XPV cells stably complemented with wild-type Pol η (XPV+WT Polη), Dead Pol η (XPV+Dead Pol η), D652A-Dead Pol η (XPV+Flag-D652A-Dead Pol η), ΔPIP-Dead Pol η (XPV+Flag-ΔPIP-Dead Pol η), or the double mutant D652A-ΔPIP Dead Pol η (XPV+Flag-D652A-ΔPIP-Dead Pol η) were analyzed by immunoblotting for the detection of Pol η, P-Chk1(ser 345), Chk1, and actin as loading control. The detection of Pol η was performed with Pol η antibodies (Abcam) in extracts from XPV+WT Polη, XPV+Dead Pol η, and XPV+Flag-D652A-Dead Pol η while the XPV+Flag-ΔPIP-Dead Pol η and the XPV+Flag-D652A-ΔPIP-Dead extracts were blotted with the FlagM2 antibody because the ΔPIP mutants are not recognized by the Pol η antibody (Abcam). Extracts from XPV cells treated with UV (20J/m2, 6 h) serves as positive control for Chk1 phosphorylation.
Figure 5.
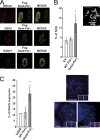
Expression of Dead Pol η stimulates homologous recombination and results in CFS instability. (A) Pol η (green), γH2AX (red), BRCA1 (red), and Rad51 (red) foci formation were revealed by immunofluorescence in U2OS cells transiently transfected with pcDNA-Flag-Dead Pol η. Triton preextraction was performed before fixation. Images obtained from confocal analysis show the colocalization of each protein with Dead Pol η. Bars, 10 µM. (B) Sister chromatid exchange analyses in U2OS cells transiently transfected with pcDNA (empty vector), pCDNA-Flag-WT Pol η, or pcDNA-Flag-Dead Pol η cells were labeled with BrdU for 45 h and treated with Karyomax for 3 h. Metaphases were spread on a glass slide and stained with Hoechst as described in Materials and methods. Differential incorporation of BrdU in each chromatid is obtained after DAPI staining and sister chromatid exchange (noted with arrows; bar, 10 µM) is scored (>3,000 chromosomes, 3 independent experiments). Standard deviations are indicated by error bars. The statistical significance was assessed using t test; *, P = 0.042. (C) Quantification and illustration of the expression of the common fragile site FRA7H (translocations, amplifications, deletions) analyzed by FISH in WT and Dead Pol η–expressing U2OS cells (3 experiments; n > 20 metaphases; standard deviations are indicated by error bars). The statistical significance was assessed using t test; *, P = 0.017. Red, FRA7H probe; green, chromosome 7 centromeric probe. Bar, 10 µM (2 µM, insets).
Figure 6.
A model for the role of Pol η at stalled forks within CFS. In particular structured DNA containing subregions of CFSs that impede fork progression, slowdown or arrest of the replicative DNA polymerases causes partial functional uncoupling of the MCM helicase and the stalled replicative DNA polymerase activities, resulting in production of short stretches of ssDNA. In DNA sequences able to adopt stable secondary structures, intramolecular folding could be formed. (A) In wild-type cells, Pol η is recruited and can perform DNA synthesis through these structures, preventing unresolved replication intermediates. (B) In the absence of Pol η, this DNA synthesis through non-B DNA can be partially rescued by alternative factors (left), but a subpopulation of stalled forks escape to this rescue pathway, generating under-replicated ssDNA after further uncoupling between polymerases and helicases in a checkpoint-blind manner, which persists into mitosis (right). (C) In the presence of inactive Dead Pol η, no DNA synthesis through structured DNA is possible by endogenous Pol η or alternative factors, causing persistent fork stalling, increased uncoupling, ssDNA accumulation, and activation of the replication checkpoint or fork collapse.
Similar articles
- Translesion polymerase eta both facilitates DNA replication and promotes increased human genetic variation at common fragile sites.
Twayana S, Bacolla A, Barreto-Galvez A, De-Paula RB, Drosopoulos WC, Kosiyatrakul ST, Bouhassira EE, Tainer JA, Madireddy A, Schildkraut CL. Twayana S, et al. Proc Natl Acad Sci U S A. 2021 Nov 30;118(48):e2106477118. doi: 10.1073/pnas.2106477118. Proc Natl Acad Sci U S A. 2021. PMID: 34815340 Free PMC article. - DNA polymerases eta and kappa exchange with the polymerase delta holoenzyme to complete common fragile site synthesis.
Barnes RP, Hile SE, Lee MY, Eckert KA. Barnes RP, et al. DNA Repair (Amst). 2017 Sep;57:1-11. doi: 10.1016/j.dnarep.2017.05.006. Epub 2017 Jun 3. DNA Repair (Amst). 2017. PMID: 28605669 Free PMC article. - Human DNA polymerase eta is required for common fragile site stability during unperturbed DNA replication.
Rey L, Sidorova JM, Puget N, Boudsocq F, Biard DS, Monnat RJ Jr, Cazaux C, Hoffmann JS. Rey L, et al. Mol Cell Biol. 2009 Jun;29(12):3344-54. doi: 10.1128/MCB.00115-09. Epub 2009 Apr 20. Mol Cell Biol. 2009. PMID: 19380493 Free PMC article. - Nontraditional Roles of DNA Polymerase Eta Support Genome Duplication and Stability.
Eckert KA. Eckert KA. Genes (Basel). 2023 Jan 9;14(1):175. doi: 10.3390/genes14010175. Genes (Basel). 2023. PMID: 36672916 Free PMC article. Review. - Genome instability at common fragile sites: searching for the cause of their instability.
Franchitto A. Franchitto A. Biomed Res Int. 2013;2013:730714. doi: 10.1155/2013/730714. Epub 2013 Sep 5. Biomed Res Int. 2013. PMID: 24083238 Free PMC article. Review.
Cited by
- First molecular-cytogenetic characterization of Fanconi anemia fragile sites in primary lymphocytes of FA-D2 patients in different stages of the disease.
Filipović J, Joksić G, Vujić D, Joksić I, Mrasek K, Weise A, Liehr T. Filipović J, et al. Mol Cytogenet. 2016 Sep 13;9(1):70. doi: 10.1186/s13039-016-0280-6. eCollection 2016. Mol Cytogenet. 2016. PMID: 27625703 Free PMC article. - A novel role for the mono-ADP-ribosyltransferase PARP14/ARTD8 in promoting homologous recombination and protecting against replication stress.
Nicolae CM, Aho ER, Choe KN, Constantin D, Hu HJ, Lee D, Myung K, Moldovan GL. Nicolae CM, et al. Nucleic Acids Res. 2015 Mar 31;43(6):3143-53. doi: 10.1093/nar/gkv147. Epub 2015 Mar 9. Nucleic Acids Res. 2015. PMID: 25753673 Free PMC article. - Under-Replicated DNA: The Byproduct of Large Genomes?
Bertolin AP, Hoffmann JS, Gottifredi V. Bertolin AP, et al. Cancers (Basel). 2020 Sep 25;12(10):2764. doi: 10.3390/cancers12102764. Cancers (Basel). 2020. PMID: 32992928 Free PMC article. Review. - FANCD2 Facilitates Replication through Common Fragile Sites.
Madireddy A, Kosiyatrakul ST, Boisvert RA, Herrera-Moyano E, García-Rubio ML, Gerhardt J, Vuono EA, Owen N, Yan Z, Olson S, Aguilera A, Howlett NG, Schildkraut CL. Madireddy A, et al. Mol Cell. 2016 Oct 20;64(2):388-404. doi: 10.1016/j.molcel.2016.09.017. Mol Cell. 2016. PMID: 27768874 Free PMC article. - Development of reconstructed intestinal micronucleus cytome (RICyt) assay in 3D human gut model for genotoxicity assessment of orally ingested substances.
Lim HK, Hughes CO, Lim MJS, Li JJ, Rakshit M, Yeo C, Chng KR, Li A, Chan JSH, Ng KW, Leavesley DI, Smith BPC. Lim HK, et al. Arch Toxicol. 2022 May;96(5):1455-1471. doi: 10.1007/s00204-022-03228-y. Epub 2022 Feb 28. Arch Toxicol. 2022. PMID: 35226136 Free PMC article.
References
Publication types
MeSH terms
Substances
LinkOut - more resources
Full Text Sources
Other Literature Sources
Miscellaneous


