Single-molecule analysis of combinatorial epigenomic states in normal and tumor cells - PubMed (original) (raw)
Single-molecule analysis of combinatorial epigenomic states in normal and tumor cells
Patrick J Murphy et al. Proc Natl Acad Sci U S A. 2013.
Abstract
Proper placement of epigenetic marks on DNA and histones is fundamental to normal development, and perturbations contribute to a variety of disease states. Combinations of marks act together to control gene expression; therefore, detecting their colocalization is important, but because of technical challenges, such measurements are rarely reported. Instead, measurements of epigenetic marks are typically performed one at a time in a population of cells, and their colocalization is inferred by association. Here, we describe a single-molecule analytical approach that can perform direct detection of multiple epigenetic marks simultaneously and use it to identify mechanisms coordinating placement of three gene silencing marks, trimethylated histone H3 lysine 9, lysine 27 (H3K9me3, H3K27me3), and cytosine methylation (mC), in the normal and cancer genome. We show that H3K9me3 and mC are present together on individual chromatin fragments in mouse embryonic stem cells and that half of the H3K9me3 marks require mC for their placement. In contrast, mC and H3K27me3 coincidence is rare, and in fact, mC antagonizes H3K27me3 in both embryonic stem cells and primary mouse fibroblasts, indicating this antagonism is shared among primary cells. However, upon immortalization or tumorigenic transformation of mouse fibroblasts, mC is required for complete H3K27me3 placement. Importantly, in human promyelocytic cells, H3K27me3 is also dependent on mC. Because aberrant placement of gene silencing marks at tumor suppressor genes contributes to tumor progression, the improper dependency of H3K27me3 by mC in immortalized cells is likely to be fundamental to cancer. Our platform can enable other studies involving coordination of epigenetic marks and leverage efforts to discover disease biomarkers and epigenome-modifying drugs.
Conflict of interest statement
Conflict of interest statement: H.G.C. and P.D.S. declare a financial interest in Odyssey Molecular, which seeks to commercialize the described methods.
Figures
Fig. 1.
SCAN workflow. (A) Native chromatin bearing epigenetic marks is mixed with fluorophore (e.g., AlexaFluor488) labeled antibody specific to a given mark. After binding, the chromatin is labeled with an intercalator (e.g., TOTO-3). Finally, the chromatin is driven by voltage through a nanoscale channel fabricated in fused silica and fluorescent measurements of individual molecules are taken in a 150-aL inspection volume. A more detailed schematic of laser setup can be found in our previous publication (10). (B) Probability of erroneously interrogating more than a single molecule increases with analyte concentration according to a Poisson distribution less than 0.5% at the concentrations used here (≤1 nM). _P_c(m), probability of m molecules residing in the 150-aL interrogation volume at any one time, given concentration c of fluorescent molecules in analyte, expressed as molecule count x in 150 aL, where NA is Avogadro’s number. The curve shows the probability that more than one molecule is in the inspection volume.
Fig. 2.
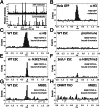
SCAN detects chromatin features with high specificity. AlexaFluor dye-tagged antibodies or MBD1 protein were bound to chromatin before analysis by SCAN. (A and B) Chromatin was from H2B-GFP expressing HeLa cells, and antibody (α-H3) was H3-specific. (A) Time-resolved photon counts (0.5 s) reporting GFP (Upper) and α-H3 (Lower) fluorescent emissions, depicted as peaks. Shading identifies antibody-bound chromatin complexes emitting both fluorophores nearly simultaneously. (B) Time-offset histogram for 7,065 GFP chromatin molecules analyzed in A. GFP fluorescent events are placed at time 0 and the time offset identifies how soon before or after the GFP emission AlexaFluor dye was detected. The peak centered at time 0 with width less than the transit time for molecules passing through the inspection volume (∼1 ms) identifies antibody–chromatin complexes. See
Fig. S2
for description of coincidence calculations. (C and D) Chromatin was from WT-ESC bound to α-H3 (C), or preimmune mouse serum (D). (E and F) Antibody probe was specific for H3K27me3 and chromatin was from WT-ESC (E) or _Eed_−/− ESC, which are deficient for H3K27me3 (F). (G and H) MBD1 probe was specific for mC in duplex DNA, and chromatin was from WT-ESC (G) or DNMT TKO ESC, which are deficient for mC (H). Chromatin in C_–_F was detected by labeling with the intercalator YOYO-1, whose emission defined the 0 time in the offset plots.
Fig. 3.
Detection of two epigenetic marks simultaneously. (A and B) Antibodies against H3 and H2B were labeled with spectrally distinct fluorophores and bound to chromatin (A), or included in a binding reaction without chromatin as a negative control (B). (C_–_E) Binding reactions were performed as in A using antibodies against H2B and H3K27me3 (C), using MBD1 protein and an antibody against H3K9me3 (D), or using MBD1 protein and an antibody against H3K4me3 (E). Chromatin was from WT-ESC; the central peak identifies chromatin molecules bound to two fluorescent probes as described in Fig. 2.
Fig. 4.
Loss of DNA methylation affects histone modification states. (A) ESC, (B) MF primary mouse fibroblasts, (C) MF3T3 immortal mouse fibroblasts, (D) MF60.1 transformed tumorigenic mouse fibroblasts, or (E) HL-60 human myeloleukemia cells had normal mC levels, or mC impaired by mutation (A), or 5-Aza-2′-deoxycytidine (5AzadC) treatment (B_–_E). Chromatin from cells was analyzed by SCAN after labeling with an intercalator (TOTO-3 or YOYO-1) and fluorescent MBD1 protein or α-H2B, α-H3K9me3 (K9) or α-H3K27me3 (K27). Coincidence values between α-H2B and intercalator were used to normalize relative abundance of H3K9me3, H3K27me3, and mC in cells with normal and impaired mC. In box plots, whiskers represent 5th and 95th percentile.
Fig. 5.
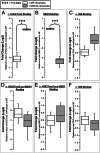
Immortalization increases H3K27me3 abundance and reduces mC abundance without changing mC and H3K27me3 coincidence. Chromatin was bound to either a single epigenetic probe and YOYO-1 (A_–_C and F), or to two different probes simultaneously (D and E). (A) Relative abundance of H3K27me3 in MF and MF3T3 chromatin. Chromatin from the two cells was labeled with the intercalator YOYO-1 and AlexaFluor647 labeled α-H3K27me3. Epigenetic mark abundance was measured as molecules labeled with both fluorophores relative to total α-H3K27me3, which was present at a 100-fold molar excess over input chromatin and served as a spike in control. H3K27me3 abundance in MF3T3 was normalized to signal from MF chromatin. (B) Relative abundance of mC in MF and MF3T3 chromatin. Analysis done as in A with AlexaFluor488 labeled MBD1, present at a 100-fold molar excess relative to chromatin, and TOTO-3-labeled chromatin. (C) Relative abundance of MF and MF3T3 chromatin used in A and B. Analysis done in parallel and as in A and B with AlexaFluor647 labeled α-H2B and YOYO-1-labeled chromatin. Lack of statistical difference indicates similarity in chromatin loading for A and B. (D and E) Relative abundance of chromatin marked by both α-H3K27me3 and MBD1. Chromatin was bound to AlexaFluor488 labeled MBD1 and AlexaFluor647 labeled α-H3K27me3, with epigenetic probes present at a 50-fold molar excess relative to chromatin. Relative abundance of chromatin bearing H3K27me3 and mC marks is shown relative to total α−H3K27me3 (D), or to total MBD1 (E). (F) Relative abundance of MF and MF3T3 chromatin used in D and E; analysis done in parallel and as in D and E with AlexaFluor647 labeled α-H2B and YOYO-1-labeled chromatin. Lack of statistical difference indicates similarity in chromatin loading for D and E.
Comment in
- Epigenomics: one molecule at a time.
Hagarman JA, Soloway PD. Hagarman JA, et al. Cell Cycle. 2013 Nov 15;12(22):3451-2. doi: 10.4161/cc.26694. Epub 2013 Oct 8. Cell Cycle. 2013. PMID: 24107626 Free PMC article. No abstract available.
Similar articles
- Coordinate regulation of DNA methylation and H3K27me3 in mouse embryonic stem cells.
Hagarman JA, Motley MP, Kristjansdottir K, Soloway PD. Hagarman JA, et al. PLoS One. 2013;8(1):e53880. doi: 10.1371/journal.pone.0053880. Epub 2013 Jan 11. PLoS One. 2013. PMID: 23326524 Free PMC article. - Chromatin H3K27me3/H3K4me3 histone marks define gene sets in high-grade serous ovarian cancer that distinguish malignant, tumour-sustaining and chemo-resistant ovarian tumour cells.
Chapman-Rothe N, Curry E, Zeller C, Liber D, Stronach E, Gabra H, Ghaem-Maghami S, Brown R. Chapman-Rothe N, et al. Oncogene. 2013 Sep 19;32(38):4586-92. doi: 10.1038/onc.2012.477. Epub 2012 Nov 5. Oncogene. 2013. PMID: 23128397 - Chicken embryonic stem cells and primordial germ cells display different heterochromatic histone marks than their mammalian counterparts.
Kress C, Montillet G, Jean C, Fuet A, Pain B. Kress C, et al. Epigenetics Chromatin. 2016 Feb 10;9:5. doi: 10.1186/s13072-016-0056-6. eCollection 2016. Epigenetics Chromatin. 2016. PMID: 26865862 Free PMC article. - Histone 3 Lysine 27 Trimethylation Signature in Breast Cancer.
Borkiewicz L. Borkiewicz L. Int J Mol Sci. 2021 Nov 27;22(23):12853. doi: 10.3390/ijms222312853. Int J Mol Sci. 2021. PMID: 34884658 Free PMC article. Review. - A Tox21 Approach to Altered Epigenetic Landscapes: Assessing Epigenetic Toxicity Pathways Leading to Altered Gene Expression and Oncogenic Transformation In Vitro.
Parfett CL, Desaulniers D. Parfett CL, et al. Int J Mol Sci. 2017 Jun 1;18(6):1179. doi: 10.3390/ijms18061179. Int J Mol Sci. 2017. PMID: 28587163 Free PMC article. Review.
Cited by
- Revved-up epigenetic sequencing may foster new diagnostics.
Duhaime-Ross A. Duhaime-Ross A. Nat Med. 2014 Jan;20(1):2. doi: 10.1038/nm0114-2. Nat Med. 2014. PMID: 24398946 No abstract available. - Post-translational modifications of PRC2: signals directing its activity.
Yang Y, Li G. Yang Y, et al. Epigenetics Chromatin. 2020 Oct 31;13(1):47. doi: 10.1186/s13072-020-00369-1. Epigenetics Chromatin. 2020. PMID: 33129354 Free PMC article. Review. - Intragenic CpG islands play important roles in bivalent chromatin assembly of developmental genes.
Lee SM, Lee J, Noh KM, Choi WY, Jeon S, Oh GT, Kim-Ha J, Jin Y, Cho SW, Kim YJ. Lee SM, et al. Proc Natl Acad Sci U S A. 2017 Mar 7;114(10):E1885-E1894. doi: 10.1073/pnas.1613300114. Epub 2017 Feb 21. Proc Natl Acad Sci U S A. 2017. PMID: 28223506 Free PMC article. - Microfluidic epigenomic mapping technologies for precision medicine.
Deng C, Naler LB, Lu C. Deng C, et al. Lab Chip. 2019 Aug 21;19(16):2630-2650. doi: 10.1039/c9lc00407f. Epub 2019 Jul 24. Lab Chip. 2019. PMID: 31338502 Free PMC article. Review. - Developmental Pathways Are Epigenetically Reprogrammed during Lung Cancer Brain Metastasis.
Karlow JA, Devarakonda S, Xing X, Jang HS, Govindan R, Watson M, Wang T. Karlow JA, et al. Cancer Res. 2022 Aug 3;82(15):2692-2703. doi: 10.1158/0008-5472.CAN-21-4160. Cancer Res. 2022. PMID: 35706127 Free PMC article.
References
- Murr R. Interplay between different epigenetic modifications and mechanisms. Adv Genet. 2010;70:101–141. - PubMed
- Bernstein BE, et al. A bivalent chromatin structure marks key developmental genes in embryonic stem cells. Cell. 2006;125(2):315–326. - PubMed
- Tamaru H, et al. Trimethylated lysine 9 of histone H3 is a mark for DNA methylation in Neurospora crassa. Nat Genet. 2003;34(1):75–79. - PubMed
Publication types
MeSH terms
Substances
Grants and funding
- T32 GM007617/GM/NIGMS NIH HHS/United States
- R01 HG006850/HG/NHGRI NIH HHS/United States
- DA025722/DA/NIDA NIH HHS/United States
- GM007617/GM/NIGMS NIH HHS/United States
- T32 HD052471/HD/NICHD NIH HHS/United States
- HG006850/HG/NHGRI NIH HHS/United States
- R01 DA025722/DA/NIDA NIH HHS/United States
LinkOut - more resources
Full Text Sources
Other Literature Sources


