Dynamic cross-regulation of antigen-specific effector and regulatory T cell subpopulations and microglia in brain autoimmunity - PubMed (original) (raw)
Dynamic cross-regulation of antigen-specific effector and regulatory T cell subpopulations and microglia in brain autoimmunity
Sara Martinez-Pasamar et al. BMC Syst Biol. 2013.
Abstract
Background: Multiple Sclerosis (MS) is considered a T-cell-mediated autoimmune disease with a prototypical oscillatory behavior, as evidenced by the presence of clinical relapses. Understanding the dynamics of immune cells governing the course of MS, therefore, has many implications for immunotherapy. Here, we used flow cytometry to analyze the time-dependent behavior of antigen-specific effector (T(eff)) and regulatory (T(reg)) T cells and microglia in mice model of MS, Experimental Autoimmune Encephalomyelitis (EAE), and compared the observations with a mathematical cross-regulation model of T-cell dynamics in autoimmune disease.
Results: We found that T(eff) and T(reg) cells specific to myelin olygodendrocyte glycoprotein (MOG) developed coupled oscillatory dynamics with a 4- to 5-day period and decreasing amplitude that was always higher for the T(eff) populations, in agreement with the mathematical model. Microglia activation followed the oscillations of MOG-specific T(eff) cells in the secondary lymphoid organs, but they were activated before MOG-specific T-cell peaks in the CNS. Finally, we assessed the role of B-cell depletion induced by anti-CD20 therapy in the dynamics of T cells in an EAE model with more severe disease after therapy. We observed that B-cell depletion decreases T(eff) expansion, although its oscillatory behavior persists. However, the effect of B cell depletion was more significant in the T(reg) population within the CNS, which matched with activation of microglia and worsening of the disease. Mathematical modeling of T-cell cross-regulation after anti-CD20 therapy suggests that B-cell depletion may influence the dynamics of T cells by fine-tuning their activation.
Conclusions: The oscillatory dynamics of T-cells have an intrinsic origin in the physiological regulation of the adaptive immune response, which influences both disease phenotype and response to immunotherapy.
Figures
Figure 1
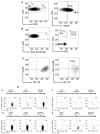
MOG-specific T cells and microglia subpopulations analyzed by flow cytometry in mice with EAE. Leukocytes were obtained from the spleen and the CNS from MOG35-55 immunized C57BL/6 mice at different stages of EAE as indicated. A) Teff and Treg lymphocytes are shown. Numbers indicate the percentage of cells within the CD4+ cell gate. The histogram on the right shows the expression of CD69 on the surface of Teff and Treg cell subsets in the spleen. Numbers indicate the percentage of CD69+ cells. B) CD4+ cells stained with MOG35-55/IAb tetramer. MOG-specific Teff and Treg cells are shown. C) Dot-plots showing CD45+CD11b+MCH-II(IAb)+ microglia population. D) Antigen-specific Teff and Treg oscillate over the course of EAE. Numbers indicate the percentage within the CD4+ cell gate. MOG-specific T cells from spleen (a, b) and CNS (c, d) in the onset, peak and recovery stages of EAE are shown. Animals were not treated (a, c) or treated with anti-CD20 antibody before immunization (b, d).
Figure 2
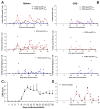
Dynamics of activated MOG-T eff , MOG-Treg cells and microglia in secondary lymphoid organs and CNS during the course of EAE. A) Percentage of MOG-specific Teff (red) or Treg (blue) in the spleen after immunization. The upper graph shows the mean of the measurements from 3 animals each day for both populations (Teff and Treg) together. The bottom panels show the distribution of all measurements (raw data) from 3 animals per day for each subpopulation as dots, with the mean in black; B) percentage of MOG-specific Teff (red) or Treg (blue) in the CNS from day 9 after immunization. The upper graph shows the mean of the measurements from 3 animals each day, while the bottom panels show the distribution of all measurements for each subpopulation as dots, with the mean in black; C) Clinical score of animals suffering EAE after immunization (mean + SD); D) Percentage of activated microglia in the CNS from day 9 after immunization.
Figure 3
Analysis of the time dependence between microglia activation and MOG-specific T-cell infiltration of the CNS. Distribution of the average of incursion of MOG-specific T cells into the CNS (Teff and Treg) versus microglia phase cycle.
Figure 4
Simulations from the cross-regulation T-cell model. A) Graphical representation and the equations of the T-cell cross-regulation model as described in [10]. Parameters of the model are described in Additional file 1: Table S1. Simulation of the time course of the number of MOG-specific Teff (red) or Treg (blue) cells in the spleen (y-axis) after immunization (x-axis, in days) by the cross-regulation model in ‘healthy’ (B) and in ‘EAE’ configuration regimes (C). Simulations are shown by mean ± SD of 3 simulations for 30 days (discretized by days) to express average points similarly to experimental data in Figure 2A; D) Phase-space plot shows Teff/Treg trajectories in simulations (30 days) for both configurations (‘healthy’ in black and ‘EAE’ in red).
Figure 5
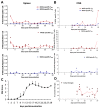
Dynamics of activated MOG-T eff , MOG-T reg cells and microglia in secondary lymphoid organs and CNS during the course of EAE after B cell depletion. A) Percentage of MOG-specific Teff (red) or Treg (blue) cells in the spleen after immunization. The upper graph shows the mean of measurements from 3 animals each day, and the bottom panels show the distribution of all measurements for each subpopulation as dots, with the mean in black; B) percentage of MOG-specific Teff (red) or Treg (blue) cells in the CNS from day 9 after immunization. The upper graph shows the mean of measurements from 3 animals each day, and the bottom panels show the distribution of all measurements for each subpopulation as dots, with the mean in black; C) clinical score of animals suffering EAE after B cell depletion (mean + SD); D) percentage of activated microglia in the CNS from day 9 after immunization.
Figure 6
Modeling the effect of anti-CD20 mediate B-cell depletion in the cross-regulation T-cell model. A) Simulation of the time course of the number of MOG -specific Teff (red) and Treg (blue) cells in the spleen (y-axis) after immunization (x-axis, in days) by the cross-regulation model using values for αreg and Keff from the ‘EAE’ regime (see Results section). B) Phase-space plots showing Teff/Treg cell counts trajectories in simulations of 100 (B) and 30 (D) days for ‘healthy’ (black), EAE (blue) and B-cell depletion (red) simulations. The 30-day simulation (D) was performed in order to compare with experimental data in C (in C, points ‘a’ and ‘b’ are marked as first peaks recorded in experiments for both groups compared). Simulations were discretized in days to show data points similar to experimental data in Figure 5A.
Similar articles
- B-cell activation influences T-cell polarization and outcome of anti-CD20 B-cell depletion in central nervous system autoimmunity.
Weber MS, Prod'homme T, Patarroyo JC, Molnarfi N, Karnezis T, Lehmann-Horn K, Danilenko DM, Eastham-Anderson J, Slavin AJ, Linington C, Bernard CC, Martin F, Zamvil SS. Weber MS, et al. Ann Neurol. 2010 Sep;68(3):369-83. doi: 10.1002/ana.22081. Ann Neurol. 2010. PMID: 20641064 Free PMC article. - A Spontaneous Model of Experimental Autoimmune Encephalomyelitis Provides Evidence of MOG-Specific B Cell Recruitment and Clonal Expansion.
Salvador F, Deramoudt L, Leprêtre F, Figeac M, Guerrier T, Boucher J, Bas M, Journiac N, Peters A, Mars LT, Zéphir H. Salvador F, et al. Front Immunol. 2022 Feb 3;13:755900. doi: 10.3389/fimmu.2022.755900. eCollection 2022. Front Immunol. 2022. PMID: 35185870 Free PMC article. - Myelin-specific regulatory T cells accumulate in the CNS but fail to control autoimmune inflammation.
Korn T, Reddy J, Gao W, Bettelli E, Awasthi A, Petersen TR, Bäckström BT, Sobel RA, Wucherpfennig KW, Strom TB, Oukka M, Kuchroo VK. Korn T, et al. Nat Med. 2007 Apr;13(4):423-31. doi: 10.1038/nm1564. Epub 2007 Mar 25. Nat Med. 2007. PMID: 17384649 Free PMC article. - The role of myelin oligodendrocyte glycoprotein in autoimmune demyelination: a target for multiple sclerosis therapy?
Lee DH, Linker RA. Lee DH, et al. Expert Opin Ther Targets. 2012 May;16(5):451-62. doi: 10.1517/14728222.2012.677438. Epub 2012 Apr 12. Expert Opin Ther Targets. 2012. PMID: 22494461 Review. - T- and B-cell responses to myelin oligodendrocyte glycoprotein in experimental autoimmune encephalomyelitis and multiple sclerosis.
Iglesias A, Bauer J, Litzenburger T, Schubart A, Linington C. Iglesias A, et al. Glia. 2001 Nov;36(2):220-34. doi: 10.1002/glia.1111. Glia. 2001. PMID: 11596130 Review.
Cited by
- CNS and CNS diseases in relation to their immune system.
Xu J, Ma C, Hua M, Li J, Xiang Z, Wu J. Xu J, et al. Front Immunol. 2022 Nov 16;13:1063928. doi: 10.3389/fimmu.2022.1063928. eCollection 2022. Front Immunol. 2022. PMID: 36466889 Free PMC article. Review. - Myalgic Encephalomyelitis/Chronic Fatigue Syndrome as a Hyper-Regulated Immune System Driven by an Interplay Between Regulatory T Cells and Chronic Human Herpesvirus Infections.
Sepúlveda N, Carneiro J, Lacerda E, Nacul L. Sepúlveda N, et al. Front Immunol. 2019 Nov 21;10:2684. doi: 10.3389/fimmu.2019.02684. eCollection 2019. Front Immunol. 2019. PMID: 31824487 Free PMC article. - Endogenous opioid inhibition of proliferation of T and B cell subpopulations in response to immunization for experimental autoimmune encephalomyelitis.
McLaughlin PJ, McHugh DP, Magister MJ, Zagon IS. McLaughlin PJ, et al. BMC Immunol. 2015 Apr 24;16:24. doi: 10.1186/s12865-015-0093-0. BMC Immunol. 2015. PMID: 25906771 Free PMC article. - Prediction of combination therapies based on topological modeling of the immune signaling network in multiple sclerosis.
Bernardo-Faura M, Rinas M, Wirbel J, Pertsovskaya I, Pliaka V, Messinis DE, Vila G, Sakellaropoulos T, Faigle W, Stridh P, Behrens JR, Olsson T, Martin R, Paul F, Alexopoulos LG, Villoslada P, Saez-Rodriguez J. Bernardo-Faura M, et al. Genome Med. 2021 Jul 16;13(1):117. doi: 10.1186/s13073-021-00925-8. Genome Med. 2021. PMID: 34271980 Free PMC article. - Complex Changes in the Innate and Adaptive Immunity Accompany Progressive Degeneration of the Nigrostriatal Pathway Induced by Intrastriatal Injection of 6-Hydroxydopamine in the Rat.
Ambrosi G, Kustrimovic N, Siani F, Rasini E, Cerri S, Ghezzi C, Dicorato G, Caputo S, Marino F, Cosentino M, Blandini F. Ambrosi G, et al. Neurotox Res. 2017 Jul;32(1):71-81. doi: 10.1007/s12640-017-9712-2. Epub 2017 Mar 11. Neurotox Res. 2017. PMID: 28285346
References
- Vollmer T. The natural history of relapses in multiple sclerosis. J Neurol Sci. 2007;256(Suppl 1):S5–S13. - PubMed
- Buljevac D, Flach HZ, Hop WC, Hijdra D, Laman JD, Savelkoul HF, Der Meche FG, van Doorn PA, Hintzen RQ. Prospective study on the relationship between infections and multiple sclerosis exacerbations. Brain. 2002;125(Pt 5):952–960. - PubMed
Publication types
MeSH terms
Substances
LinkOut - more resources
Full Text Sources
Other Literature Sources


