Measuring image resolution in optical nanoscopy - PubMed (original) (raw)
Measuring image resolution in optical nanoscopy
Robert P J Nieuwenhuizen et al. Nat Methods. 2013 Jun.
Abstract
Resolution in optical nanoscopy (or super-resolution microscopy) depends on the localization uncertainty and density of single fluorescent labels and on the sample's spatial structure. Currently there is no integral, practical resolution measure that accounts for all factors. We introduce a measure based on Fourier ring correlation (FRC) that can be computed directly from an image. We demonstrate its validity and benefits on two-dimensional (2D) and 3D localization microscopy images of tubulin and actin filaments. Our FRC resolution method makes it possible to compare achieved resolutions in images taken with different nanoscopy methods, to optimize and rank different emitter localization and labeling strategies, to define a stopping criterion for data acquisition, to describe image anisotropy and heterogeneity, and even to estimate the average number of localizations per emitter. Our findings challenge the current focus on obtaining the best localization precision, showing instead how the best image resolution can be achieved as fast as possible.
Figures
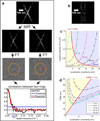
Figure 1. The FIRE principle and trade-off between localization uncertainty and labeling density
a, All localizations are divided into two halves, the correlation of their Fourier transforms over the perimeter of circles in Fourier space of radius q is calculated, resulting in an FRC curve indicating the decay of the correlation with spatial frequency. The image resolution is the inverse of the spatial frequency for which the FRC curve drops below the threshold 1/7 ≈ 0.143, e.g. a threshold value at q = 0.04 nm−1 is equivalent to 25 nm resolution b, Simulated localization microscopy image of a line pair with mean labeling density in the area occupied by the lines ρ = 2.5 · 103μm−2 and localization uncertainty σ = 7.6 nm (line distance 70 nm, cosine squared cross-section as defined in Supplementary Note 2). c, Theory (lines) and simulation data (circles) of constant FIRE value (20, 40, . . ., 100 nm) for line pairs as in b as a function of localization uncertainty and labeling density in the area occupied by the lines. Regions of localization uncertainty limited resolution (blue) and labeling density limited resolution (yellow) are separated by the red line ρσ2 = e/6π. d, Localization uncertainty versus image resolution for different fixed total measurement times (1, 5, 10, 20 and 30 min.). Camera frame rates were varied to match the on-times of the emitter. The minima of the curves fall on the red line FIRE = 2πσ that separates the yellow region in which not enough emitters have been localized from the blue region in which the emitters have not been localized precisely enough.
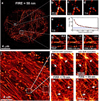
Figure 2. The effect of density of localizations and data processing on resolution
a, Localization microscopy image of tubulin labeled with Alexa 647 in a HeLa cell (FIRE = 58±1 nm for the whole image). The image is obtained from 1.4 · 104 frames recorded in 4 min, the localization uncertainty is σ = 9.7 nm after merging nearby localizations in subsequent image frames (Supplementary Methods, sec. 3.3) and the density of localizations is ρ = 6.0 · 102μm−2. b–e, Zoomed insets of two crossing lines constructed from fewer time frames showing poorer resolutions (indicated by the distance between the blue arrows). f, Resolution build-up during the entire data acquisition with FIRE = 2πσ plotted in blue, showing a transition from density limited resolution to precision limited resolution close to the end of the data acquisition. At the end of data acquisition we reach ρσ2 = 0.06 on the order of the rule-of-thumb value 0.14 for the transition point (see Eq.(4)). g–i, Reconstructions by different localization algorithms showing that MLE (g, FIRE = 58±1 nm) and LS (h, FIRE = 60±1 nm) methods outperform CEN (i, FIRE = 88±2 nm). j, Localization microscopy image of actin cytoskeleton (F-actin) of a fixed HeLa cell labeled with Phalloidin coupled to Alexa 647, after correction for sample drift of ~ 70–100 nm during acquisition. The image is obtained from 5.0 · 104 frames recorded in 8 min, the localization uncertainty (after merging nearby localizations in subsequent image frames) is σ = 8.0 nm and the density of localizations is ρ = 8.2 · 103μm−2 (ρσ2 = 0.52, 2πσ = 50 nm). k–n, Zoomed insets of reconstructions before (k, m) and after (l, n) drift correction show that more detail is visible after drift correction, which is reflected by a better FIRE value for the entire image after drift correction (54±1 nm compared to 79±2 nm before drift correction).
Figure 3. Spurious correlations from two-color localization microscopy image
a, b, Overview image of a tubulin network (a) labeled with both Alexa 647 (red) and Alexa 750 (green), and inset (b) showing the quality of registration. c, The uncorrected FRC curves for the red and green channel are significantly higher than the cross-channel curve due to spurious correlations from repeated photo-activations of individual emitters, resulting in overly optimistic FIRE values for the red and green channels (25±1 nm and 34±1 nm, respectively, compared to 118±2 nm for the cross-channel). d, FRC curves corrected for spurious correlations are much closer to each other and give rise to similar FIRE values (108±1 nm for Alexa 647, 133±2 nm for Alexa 750, 121±2 nm for the cross-channel). e–g, Scaled FRC numerator curves showing a plateau for intermediate spatial frequencies, which is used to estimate the correction term and the parameter Q that determines the average number of localizations per binding site (Q = 10 for Alexa 647, Q = 18 for Alexa 750, Q = 0.3 for the cross-channel). For this correction (see Supplementary Methods, sec. 1) we used a mean and width of the distribution of localization uncertainties equal to 9.2 and 2.8 nm for Alexa 647, and 12 and 2.0 nm for Alexa 750.
Figure 4. 3D-FIRE
a, Orthogonal slices of the Fourier Plane Correlation (FPC) of a 3D localization microscopy image of a tubulin network. b–d, Cross-sections of the _qxqz_-plane, the _qyqz_-plane, and the _qxqy_-plane of the Fourier Plane Correlation, with added resolution threshold contours FPC = 1/7 (black lines). e, Representation of the 3D tubulin network, with the axial coordinate in false color. The FPC clearly shows the anisotropy of image content resulting from the line-like structure of the filaments (highest image resolution perpendicular to the filaments), as well as from the anisotropy in localization uncertainty (lowest resolution in the axial direction).
Similar articles
- Estimation theoretic measure of resolution for stochastic localization microscopy.
Fitzgerald JE, Lu J, Schnitzer MJ. Fitzgerald JE, et al. Phys Rev Lett. 2012 Jul 27;109(4):048102. doi: 10.1103/PhysRevLett.109.048102. Epub 2012 Jul 24. Phys Rev Lett. 2012. PMID: 23006110 Free PMC article. - Zooming in on biological processes with fluorescence nanoscopy.
Agrawal U, Reilly DT, Schroeder CM. Agrawal U, et al. Curr Opin Biotechnol. 2013 Aug;24(4):646-53. doi: 10.1016/j.copbio.2013.02.016. Epub 2013 Mar 13. Curr Opin Biotechnol. 2013. PMID: 23498844 Review. - Lightsheet localization microscopy enables fast, large-scale, and three-dimensional super-resolution imaging.
Lu CH, Tang WC, Liu YT, Chang SW, Wu FCM, Chen CY, Tsai YC, Yang SM, Kuo CW, Okada Y, Hwu YK, Chen P, Chen BC. Lu CH, et al. Commun Biol. 2019 May 9;2:177. doi: 10.1038/s42003-019-0403-9. eCollection 2019. Commun Biol. 2019. PMID: 31098410 Free PMC article. - Fast, three-dimensional super-resolution imaging of live cells.
Jones SA, Shim SH, He J, Zhuang X. Jones SA, et al. Nat Methods. 2011 Jun;8(6):499-508. doi: 10.1038/nmeth.1605. Epub 2011 May 8. Nat Methods. 2011. PMID: 21552254 Free PMC article. - Super-resolution microscopy approaches to nuclear nanostructure imaging.
Cremer C, Szczurek A, Schock F, Gourram A, Birk U. Cremer C, et al. Methods. 2017 Jul 1;123:11-32. doi: 10.1016/j.ymeth.2017.03.019. Epub 2017 Apr 6. Methods. 2017. PMID: 28390838 Review.
Cited by
- Dense small molecule labeling enables activator-dependent STORM by proximity mapping.
Chen Y, Gu M, Gunning PW, Russell SM. Chen Y, et al. Histochem Cell Biol. 2016 Sep;146(3):255-66. doi: 10.1007/s00418-016-1451-6. Epub 2016 May 31. Histochem Cell Biol. 2016. PMID: 27246003 - Minimizing Molecular Misidentification in Imaging Low-Abundance Protein Interactions Using Spectroscopic Single-Molecule Localization Microscopy.
Zhang Y, Wang G, Huang P, Sun E, Kweon J, Li Q, Zhe J, Ying LL, Zhang HF. Zhang Y, et al. Anal Chem. 2022 Oct 11;94(40):13834-13841. doi: 10.1021/acs.analchem.2c02417. Epub 2022 Sep 27. Anal Chem. 2022. PMID: 36165784 Free PMC article. - Combined AFM and super-resolution localisation microscopy: Investigating the structure and dynamics of podosomes.
Hirvonen LM, Marsh RJ, Jones GE, Cox S. Hirvonen LM, et al. Eur J Cell Biol. 2020 Sep;99(7):151106. doi: 10.1016/j.ejcb.2020.151106. Epub 2020 Jul 22. Eur J Cell Biol. 2020. PMID: 33070038 Free PMC article. - Self-inspired learning for denoising live-cell super-resolution microscopy.
Qu L, Zhao S, Huang Y, Ye X, Wang K, Liu Y, Liu X, Mao H, Hu G, Chen W, Guo C, He J, Tan J, Li H, Chen L, Zhao W. Qu L, et al. Nat Methods. 2024 Oct;21(10):1895-1908. doi: 10.1038/s41592-024-02400-9. Epub 2024 Sep 11. Nat Methods. 2024. PMID: 39261639 - Small Fluorogenic Amino Acids for Peptide-Guided Background-Free Imaging.
de Moliner F, Konieczna Z, Mendive-Tapia L, Saleeb RS, Morris K, Gonzalez-Vera JA, Kaizuka T, Grant SGN, Horrocks MH, Vendrell M. de Moliner F, et al. Angew Chem Int Ed Engl. 2023 Jan 23;62(4):e202216231. doi: 10.1002/anie.202216231. Epub 2022 Dec 14. Angew Chem Int Ed Engl. 2023. PMID: 36412996 Free PMC article.
References
- Hell SW, Wichmann J. Breaking the diffraction limit resolution by stimulated emission: stimulated-emission-depletion microscopy. Opt. Lett. 1994;19:780–783. - PubMed
- Betzig E, et al. Imaging intracellular fluorescent proteins at nanometer resolution. Science. 2006;313:1643–1645. - PubMed
- Fölling J, et al. Fluorescence nanoscopy by ground-state depletion and single-molecule return. Nat. Meth. 2008;5:943–945. - PubMed
Publication types
MeSH terms
Substances
LinkOut - more resources
Full Text Sources
Other Literature Sources


