Cocaine inhibits dopamine D2 receptor signaling via sigma-1-D2 receptor heteromers - PubMed (original) (raw)
. 2013 Apr 18;8(4):e61245.
doi: 10.1371/journal.pone.0061245. Print 2013.
Estefania Moreno, Jordi Bonaventura, Marc Brugarolas, Daniel Farré, David Aguinaga, Josefa Mallol, Antoni Cortés, Vicent Casadó, Carmen Lluís, Sergi Ferre, Rafael Franco, Enric Canela, Peter J McCormick
Affiliations
- PMID: 23637801
- PMCID: PMC3630156
- DOI: 10.1371/journal.pone.0061245
Cocaine inhibits dopamine D2 receptor signaling via sigma-1-D2 receptor heteromers
Gemma Navarro et al. PLoS One. 2013.
Abstract
Under normal conditions the brain maintains a delicate balance between inputs of reward seeking controlled by neurons containing the D1-like family of dopamine receptors and inputs of aversion coming from neurons containing the D2-like family of dopamine receptors. Cocaine is able to subvert these balanced inputs by altering the cell signaling of these two pathways such that D1 reward seeking pathway dominates. Here, we provide an explanation at the cellular and biochemical level how cocaine may achieve this. Exploring the effect of cocaine on dopamine D2 receptors function, we present evidence of σ1 receptor molecular and functional interaction with dopamine D2 receptors. Using biophysical, biochemical, and cell biology approaches, we discovered that D2 receptors (the long isoform of the D2 receptor) can complex with σ1 receptors, a result that is specific to D2 receptors, as D3 and D4 receptors did not form heteromers. We demonstrate that the σ1-D2 receptor heteromers consist of higher order oligomers, are found in mouse striatum and that cocaine, by binding to σ1 -D2 receptor heteromers, inhibits downstream signaling in both cultured cells and in mouse striatum. In contrast, in striatum from σ1 knockout animals these complexes are not found and this inhibition is not seen. Taken together, these data illuminate the mechanism by which the initial exposure to cocaine can inhibit signaling via D2 receptor containing neurons, destabilizing the delicate signaling balance influencing drug seeking that emanates from the D1 and D2 receptor containing neurons in the brain.
Conflict of interest statement
Competing Interests: The authors have declared that no competing interests exist.
Figures
Figure 1. Molecular interaction between σ1 receptors and D2 receptors in living cells.
BRET saturation experiments were performed with HEK-293T cells co-transfected with: (a) D2-RLuc cDNA (0.4 µg, squares) or adenosine A2A-RLuc cDNA as negative control (0.2 µg, triangles) and increasing amounts of σ1-YFP cDNA (0.1 to 1 µg cDNA), (b) D3-RLuc cDNA (0.5 µg, squares) or D4-RLuc cDNA (0.5 µg, triangles) and increasing amounts of σ1-YFP cDNA (0.1 to 1 µg cDNA). The relative amount of BRET acceptor is given as the ratio between the fluorescence of the acceptor minus the fluorescence detected in cells only expressing the donor, and the luciferase activity of the donor (YFP/Rluc). BRET data are expressed as means ± S.D. of five to six different experiments grouped as a function of the amount of BRET acceptor. In (c) confocal microscopy images of HEK-293T cells transfected with D2-YFP or σ1-RLuc (top panels) or co-transfected with D2-YFP and σ1-RLuc (bottom panels), treated (right images) or not (left images) with 30 µM cocaine for 30 min. σ1 receptors (red) were identified by immunocytochemistry and D2 receptors (green) were identified by its own fluorescence. Co-localization is shown in yellow. Scale bar:10 µm.
Figure 2. Higher order complex formation between σ1 receptors and dopamine D2 receptors in living cells.
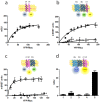
In (a) BRET saturation experiments were performed with HEK-293T cells co-transfected with σ1-RLuc cDNA (0.2 µg) and increasing amounts of σ1-YFP cDNA (0.1 to 0.6 µg cDNA). A schematic representation of a BRET process is shown at top in which the receptor fused to RLuc acts as donor and the receptor fused to YFP acts as acceptor. In (b) and (c) SRET saturation experiments were performed with HEK-293T cells co-transfected with: (b) a constant amount of D2-RLuc (0.6 µg) and D2-GFP2 (1 µg) receptor cDNA (squares) or A2A-RLuc (0.3 µg) and A2A-GFP2 (0.5 µg) receptor cDNA, as negative control (triangles), and increasing amounts of σ1-YFP receptor (0.2 to 1.5 µg cDNA), (c) a constant amount of σ1-Rluc (0.3 µg) and D2-GFP2 (1 µg) (triangles) or A2-GFP2 (0.5 µM) as negative control (squares) receptor cDNA and increasing amounts of σ1-YFP receptor cDNA (0.2 to 1.5 µg). The relative amount of acceptor is given as the ratio between the fluorescence of the acceptor minus the fluorescence detected in cells only expressing the donor, and the luciferase activity of the donor (YFP/Rluc). A schematic representation of a SRET process is shown at top images in which two sequential energy transfer events between Rluc and GFP2 (BRET process) and between GFP2 and YFP (FRET process) occurs. In (d) BRET with luminescence/fluorescence complementation approach was performed measuring BRET in cells co-transfected with 1 µg of the two cDNAs corresponding to D2-nRLuc8 and D2-cRLuc8 and with 1.5 µg of the two cDNAs corresponding to σ1-nVenus and σ1-cVenus (5). As negative controls, cells transfected with the same amount of cDNA corresponding to D2-nRLuc8, D2-cRLuc8, σ1-nVenus and cVenus (1), D2-nRLuc8, D2-cRLuc8, σ1-cVenus and nVenus (2), D2-nRLuc8, σ1-nVenus, σ1-cVenus and cRLuc8 (3), or D2-cRLuc8, σ1-nVenus, σ1-cVenus and nRLuc8 (4) did not display any significant luminescence or positive BRET. A schematic representation of a BRET with luminescence/fluorescence complementation approach is given at the top image in which one receptor fused to the N-terminal fragment (nRluc8) and another receptor fused to the C-terminal fragment (cRluc8) of the Rluc8 act as BRET donor after Rluc8 reconstitution by a close receptor-receptor interaction and one receptor fused to an YFP Venus N-terminal fragment (nVenus) and another receptor fused to the YFP Venus C-terminal fragment (cVenus), act as BRET acceptor after YFP Venus reconstitution by a close receptor-receptor interaction. BRET or SRET data are expressed as means ± S.D. of five to six different experiments grouped as a function of the amount of BRET or SRET acceptor.
Figure 3. Effect of σ1 receptor ligands on σ1-D2 receptor heteromer.
BRET was measured in HEK-293T cells cotransfected with: (a) D2–Rluc cDNA (0.4 µg) and increasing amounts of σ1-YFP receptor cDNA (0.1 to 1 µg), (b) σ1–Rluc cDNA (0.2 µg) and increasing amounts of σ1-YFP receptor cDNA (0.1 to 1 µg), (c) D2–Rluc cDNA (0.4 µg) and increasing amounts of D2-YFP receptor cDNA (0.2 to 2 µg) or (d) siRNA corresponding to σ1 receptor (see Methods), D2–Rluc cDNA (0.4 µg) and increasing amounts of D2-YFP receptor cDNA (0.2 to 2 µg), not treated (black), treated for 30 min with 30 µM cocaine (red), treated for 10 min with 100 nM PRE084 (blue) or 1 µM PD144418 (green) or treated for 30 min with 30 µM cocaine and 1 µM PD144418 (orange). The relative amount of BRET acceptor is given as the ratio between the fluorescence of the acceptor minus the fluorescence detected in cells only expressing the donor, and the luciferase activity of the donor (YFP/Rluc). BRET data are expressed as means ± SD of four to six different experiments grouped as a function of the amount of BRET acceptor.
Figure 4. Cocaine binding to σ1 receptor modulates the Gi-dependent D2 receptor signaling in transfected cells.
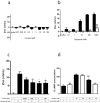
In (a to c) CellKey label-free assays were performed in CHO cells stable expressing D2 receptors. In (a) cells were stimulated with buffer (B) or with increasing concentrations of cocaine. In (b) cells were preincubated (black columns) or not (white columns) with PTx (10 ng/ml) overnight and stimulated with buffer (B) or increasing concentrations of quinpirole. In (c) cells were stimulated with increasing concentrations of cocaine in the presence of 10 nM of quinpirole. In (d) cAMP production was determined in CHO cells stable expressing D2 receptors not transfected (black columns) or transfected (white columns) with siRNA corresponding to σ1 receptor (6.25 µg of oligonucleotides) and stimulated with 5 µM forskolin in absence (100%) or presence of 1 µM quinpirole, 30 µM cocaine alone or in combination. Percent of cAMP produced respect to 5 µM forskolin treatment was represented. Results are as mean ± S.E.M from 4–8 independent experiments. Statistical significance was calculated by one way ANOVA followed by Bonferroni multiple comparison test; in b **p<0.01 and ***p<0.005 compared with cells not transfected with siRNA, in c *p<0.05 compared with cells only treated with quinpirole, in d &&p<0.01 compared to the corresponding quinpirole-treated cells and *p<0.05 and ***p<0.005 compared with forskolin-treated cells (100%).
Figure 5. Cocaine binding to σ1 receptor modulates the ERK 1/2 signaling in transfected cells.
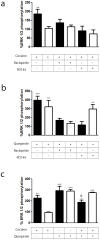
CHO cells were transfected with D2 receptor cDNA (1 µg, black bars) or cotransfected (white bars) with D2 receptor cDNA and σ1 receptor siRNA (6.25 µg of oligonucleotides). Cells were incubated for 30 min (a) or 10 min (b) with medium (basal) or with 30 µM cocaine (a) or 1 µM quinpirole (b) in the absence or in the presence of 10 µM raclopride or 100 nM PD144418. In (c) cells were treated with medium (basal), 30 µM cocaine for 30 min, 1 µM quinpirole for 10 min or 30 µM cocaine for 30 min and, during the last 10 min, with 1 µM quinpirole. In all cases, ERK 1/2 phosphorylation is represented as percentage over basal levels (100%). Results are mean ± SEM of six to eight independent experiments performed in duplicate. Bifactorial ANOVA showed a significant (**p<0.01 and ***P<0.005) effect over basal.
Figure 6. Expression of σ1-D2 receptor heteromers in the striatum.
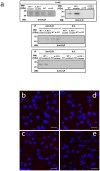
In (a) co-immunoprecipitation experiments are shown. Striatal slices from WT and KO mice were untreated or treated with 150 µM cocaine for 30 min. From slices solubilized striatal membranes (top panel) and immunoprecipitates with anti-D2 receptor antibody or anti-FLAG antibody as negative control (NC) (middle and bottom panels) were analyzed by SDS-PAGE and immunoblotted using mouse anti-D2 receptor antibody or mouse anti-σ1 receptor antibody. IP: immunoprecipitation; WB: western blotting; MW, molecular mass. In (b to e) Proximity Ligation Assay (PLA) was performed as indicated in Materials and Methods, using WT (b and d) or KO (c and e) mouse striatal slices not treated (b and c) or treated (d and e) with 150 µM cocaine for 30 min. σ1-D2 receptor heteromers were visualized as red spots around blue colored DAPI stained nucleus. Scale bar: 20 µm.
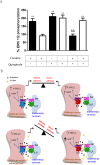
Figure 7. Negative cross-talk between cocaine and the D2 receptor agonist quinpirole on ERK 1/2 phosphorylation in mice striatum.
In (a) WT (black bars) and σ1 receptor KO (white bars) mouse striatal slices were treated with 1 µM quinpirole for 10 min, with 150 µM cocaine for 30 min or with cocaine for 30 min and, during the last 10 min, with quinpirole. Immunoreactive bands from six slices obtained from five WT or five KO animals were quantified for each condition. Values represent mean ± SEM of percentage of phosphorylation relative to basal levels found in untreated slices. No significant differences were obtained between the basal levels of the WT and the σ1 receptor KO mice. Bifactorial ANOVA showed a significant (*p<0.05, **p<0.01, ***p<0.005) effect over basal. One-way ANOVA followed by Bonferroni post hoc tests showed a significant cocaine-mediated counteraction of quinpirole (&p<0.05, &&p<0.01). In (b) a representative scheme summarizing the overall results is shown. Top images represent D2 and D1 receptors signaling in the indirect and direct striatal pathway neurons after dopamine binding. Bottom images represent the effect of cocaine increasing the dopamine by inhibiting dopamine transporters (DAT) and interacting with σ1 receptors within σ1-D2 and σ1-D1 receptor heteromers, changing the dopamine receptor signaling.
Similar articles
- Evidence against dopamine D1/D2 receptor heteromers.
Frederick AL, Yano H, Trifilieff P, Vishwasrao HD, Biezonski D, Mészáros J, Urizar E, Sibley DR, Kellendonk C, Sonntag KC, Graham DL, Colbran RJ, Stanwood GD, Javitch JA. Frederick AL, et al. Mol Psychiatry. 2015 Nov;20(11):1373-85. doi: 10.1038/mp.2014.166. Epub 2015 Jan 6. Mol Psychiatry. 2015. PMID: 25560761 Free PMC article. - Dopamine D1-D2 receptor heteromer expression in key brain regions of rat and higher species: Upregulation in rat striatum after cocaine administration.
Hasbi A, Sivasubramanian M, Milenkovic M, Komarek K, Madras BK, George SR. Hasbi A, et al. Neurobiol Dis. 2020 Sep;143:105017. doi: 10.1016/j.nbd.2020.105017. Epub 2020 Jul 14. Neurobiol Dis. 2020. PMID: 32679312 Free PMC article. - Cocaine modulates allosteric D2-σ1 receptor-receptor interactions on dopamine and glutamate nerve terminals from rat striatum.
Beggiato S, Borelli AC, Borroto-Escuela D, Corbucci I, Tomasini MC, Marti M, Antonelli T, Tanganelli S, Fuxe K, Ferraro L. Beggiato S, et al. Cell Signal. 2017 Dec;40:116-124. doi: 10.1016/j.cellsig.2017.09.007. Epub 2017 Sep 18. Cell Signal. 2017. PMID: 28923416 - Dopamine D1 and D3 receptor polypharmacology as a potential treatment approach for substance use disorder.
Galaj E, Ewing S, Ranaldi R. Galaj E, et al. Neurosci Biobehav Rev. 2018 Jun;89:13-28. doi: 10.1016/j.neubiorev.2018.03.020. Epub 2018 Mar 22. Neurosci Biobehav Rev. 2018. PMID: 29577963 Review. - DA D2 receptors in the ventral striatum: multiple effects or receptor subtypes?
White FJ, Hu XT, Zhang XF. White FJ, et al. Nihon Shinkei Seishin Yakurigaku Zasshi. 1997 Apr;17(2):91-5. Nihon Shinkei Seishin Yakurigaku Zasshi. 1997. PMID: 9201729 Review.
Cited by
- Age-dependent effects of social isolation on mesolimbic dopamine release.
McWain MA, Pace RL, Nalan PA, Lester DB. McWain MA, et al. Exp Brain Res. 2022 Oct;240(10):2803-2815. doi: 10.1007/s00221-022-06449-w. Epub 2022 Sep 3. Exp Brain Res. 2022. PMID: 36057752 Free PMC article. - Allosteric Modulators of Sigma-1 Receptor: A Review.
Vavers E, Zvejniece L, Maurice T, Dambrova M. Vavers E, et al. Front Pharmacol. 2019 Mar 19;10:223. doi: 10.3389/fphar.2019.00223. eCollection 2019. Front Pharmacol. 2019. PMID: 30941035 Free PMC article. Review. - Pharmacological stimulation of sigma-1 receptor promotes activation of astrocyte via ERK1/2 and GSK3β signaling pathway.
Wang Y, Jiang HF, Ni J, Guo L. Wang Y, et al. Naunyn Schmiedebergs Arch Pharmacol. 2019 Jul;392(7):801-812. doi: 10.1007/s00210-019-01632-3. Epub 2019 Feb 23. Naunyn Schmiedebergs Arch Pharmacol. 2019. PMID: 30798370 - Developmental origins of brain disorders: roles for dopamine.
Money KM, Stanwood GD. Money KM, et al. Front Cell Neurosci. 2013 Dec 19;7:260. doi: 10.3389/fncel.2013.00260. Front Cell Neurosci. 2013. PMID: 24391541 Free PMC article. Review. - Understanding the Role of GPCR Heteroreceptor Complexes in Modulating the Brain Networks in Health and Disease.
Borroto-Escuela DO, Carlsson J, Ambrogini P, Narváez M, Wydra K, Tarakanov AO, Li X, Millón C, Ferraro L, Cuppini R, Tanganelli S, Liu F, Filip M, Diaz-Cabiale Z, Fuxe K. Borroto-Escuela DO, et al. Front Cell Neurosci. 2017 Feb 21;11:37. doi: 10.3389/fncel.2017.00037. eCollection 2017. Front Cell Neurosci. 2017. PMID: 28270751 Free PMC article. Review.
References
- Kreitzer AC, Malenka RC (2008) Striatal plasticity and basal ganglia circuit function. Neuron 60: 543–554 doi:10.1016/j.neuron.2008.11.005. - DOI - PMC - PubMed
- Gerfen CR, Engber TM, Mahan LC, Susel Z, Chase TN, et al. (1990) D1 and D2 dopamine receptor-regulated gene expression of striatonigral and striatopallidal neurons. Science 250: 1429–1432. - PubMed
- Kalivas PW, Volkow ND (2005) The neural basis of addiction: a pathology of motivation and choice. Am J Psychiatry 162: 1403–1413 doi:10.1176/appi.ajp.162.8.1403. - DOI - PubMed
- Di Chiara G, Bassareo V (2007) Reward system and addiction: what dopamine does and doesn’t do. Current Opinion in Pharmacology 7: 69–76 doi:10.1016/j.coph.2006.11.003. - DOI - PubMed
Publication types
MeSH terms
Substances
Grants and funding
This study was supported by grants from the Spanish Ministerio de Ciencia y Tecnología (SAF2009-07276, SAF2010-18472, SAF2011-23813), and by Intramural Funds of the National Institute on Drug Abuse to SF. PJM is a Ramón y Cajal Fellow. The funders had no role in study design, data collection and analysis, decision to publish, or preparation of the manuscript.
LinkOut - more resources
Full Text Sources
Other Literature Sources
Molecular Biology Databases

