Nucleotide degradation and ribose salvage in yeast - PubMed (original) (raw)
Nucleotide degradation and ribose salvage in yeast
Yi-Fan Xu et al. Mol Syst Biol. 2013.
Abstract
Nucleotide degradation is a universal metabolic capability. Here we combine metabolomics, genetics and biochemistry to characterize the yeast pathway. Nutrient starvation, via PKA, AMPK/SNF1, and TOR, triggers autophagic breakdown of ribosomes into nucleotides. A protein not previously associated with nucleotide degradation, Phm8, converts nucleotide monophosphates into nucleosides. Downstream steps, which involve the purine nucleoside phosphorylase, Pnp1, and pyrimidine nucleoside hydrolase, Urh1, funnel ribose into the nonoxidative pentose phosphate pathway. During carbon starvation, the ribose-derived carbon accumulates as sedoheptulose-7-phosphate, whose consumption by transaldolase is impaired due to depletion of transaldolase's other substrate, glyceraldehyde-3-phosphate. Oxidative stress increases glyceraldehyde-3-phosphate, resulting in rapid consumption of sedoheptulose-7-phosphate to make NADPH for antioxidant defense. Ablation of Phm8 or double deletion of Pnp1 and Urh1 prevent effective nucleotide salvage, resulting in metabolite depletion and impaired survival of starving yeast. Thus, ribose salvage provides means of surviving nutrient starvation and oxidative stress.
Conflict of interest statement
The authors declare that they have no conflict of interest.
Figures
Figure 1
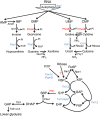
Yeast pathway map of nucleotide degradation and ribose salvage. The pathway begins with the degradation of RNA. In starvation, this is triggered by macroautophagy (ribophagy). The resulting nucleotides are degraded into nucleosides except for AMP, which is first converted to IMP (Walther et al, 2010). Purine nucleosides are then converted into ribose-1-phosphate and base, whereas pyrimidines are hydrolyzed into ribose and base. Both ribose and ribose-1-phosphate are converted into ribose-5-phosphate, which enters the nonoxidative branch of PPP. Gene annotations that are taken from definitive prior literature are shown in black; those confirmed by experiments in this study are shown in blue, and those newly assigned in this study are shown in red. Incorrect and missing annotations in the current genome scale metabolic model (Herrgard et al, 2008) (
http://www.comp-sys-bio.org/yeastnet/
) are listed in Supplementary Table S1. The enzyme converting ribose to R5P remains unclear. G6P, glucose-6-phosphate; FBP, fructose-1,6-bisphosphate; GAP, glyceraldehyde-3-phosphate; DHAP, dihydroxyacetone phosphate; R5P, ribose-5-phosphate; X5P, xylulose-5-phosphate; Ru5P, ribulose-5-phosphate; E4P, erythrose-4-phosphate.
Figure 2
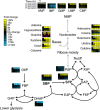
Starvation triggers accumulation of nucleosides, bases and S7P. Wild-type S. cerevisiae cells growing in minimal media were switched to minimal media containing no carbon, no nitrogen or no phosphate. After the indicated duration of starvation, the metabolome was quantified by LC-MS. For media composition, see Supplementary Table S2. For the list of absolute concentration of metabolties, see Supplementary Table S3. Data are shown in heat map format, with each line reflecting the dynamics of a particular compound in a particular culture condition. Metabolite levels of biological duplicates were averaged, normalized to cells growing steadily in glucose (time zero), and the resulting fold changes log2 transformed.
Figure 3
In carbon starvation, nucleosides and PPP compounds are produced by RNA degradation via autophagy in response to kinase signals. (A) Experimental design for demonstrating metabolite production via macromolecule degradation. Yeast cells were grown on 2% unlabeled glucose, and then switched to U-13C-glucose for 70 min, which completely labels free metabolite but only partially labels macromolecules. Thereafter, glucose was removed and the metabolome analyzed by LC-MS. (B) Fraction of unlabeled nucleosides, nucleic bases and PPP intermediates as a function of starvation time, in wild-type and autophagy deficient (atg7 deletion) yeast. The x axis represents minutes after carbon starvation, and the y axis represents fraction of unlabeled metabolites (mean±range of _N_=2 biological replicates). (C) Ratio of metabolite levels in atg7 strain versus wild-type strain in carbon starvation. (D) Ratio of metabolite levels in bcy1 strain and snf1 strain versus wild-type strain in carbon starvation. (E) Ratio of metabolite levels in rapamycin treatment versus nitrogen starvation for wild-type yeast. In (C) to (E), all reported values are log2 transformed ratios; data are mean of duplicate samples at each time point.
Figure 4
Phm8 is the physiological yeast nucleotidase. (A) Ratio of metabolite levels in sdt1 and phm8 strains versus wild-type strain in carbon starvation. All reported values are log2 transformed ratios; data are mean of duplicate samples at each time point. (B) Summary of transcripts data of PHM8, SDT1 and other enzymes in the pathway (Gasch et al, 2000; Bradley et al, 2009; Klosinska et al, 2011). All values are log2 transformed fold changes. (C) Screening of Phm8’s phosphatase activity against 90 phosphorylated compounds. Phosphatase activity was measured in the presence of 0.5 mM substrate and 5 mM Mg2+ (pH=7.0, 30°C). Compounds with specific activity higher than 0.1 μmol/mg/min are shown. The x axis represents specific phosphatase activity (μmol of phosphate produced per minute per mg of enzyme, mean±range of _N_=2 replicates). (D) Top table: absolute intracellular concentration of nucleotide monophosphates in carbon starvation. Bottom plots: Phosphatase activity of Phm8 and Sdt1 as a function of CMP concentration. The x axis represents CMP concentration and the y axis represents specific phosphatase activity (μmol of phosphate produced per minute per mg of enzyme, mean±range of _N_=2 replicates).
Figure 5
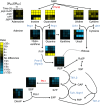
Confirmation that Pnp1 is the physiological purine nucleoside phosphorylase, Urh1 is the pyrimidine hydrolase, and Prm15 (Pgm3) is the phosphoribomutase. Ratio of metabolite levels in pnp1/urh1, pnp1, urh1 and prm15 (pgm3) strains versus wild-type strain during carbon starvation. Data are shown in heat map format, with each line reflecting the dynamics of the ratio of the metabolite levels in a particular strain versus wild-type strain. All reported values are log2 transformed ratios; data are mean of duplicate samples at each time point.
Figure 6
Nucleoside degradation causes S7P accumulation due to depletion of the other transaldolase substrate glyceraldehyde-3-phosphate, and SBP accumulation due to phosphorylation of S7P into SBP by Pfk1. (A) Diagram of proposed reactions. (B–E) DHAP, SBP and S7P levels in wild type, tkl1/tkl2 (B), tal1/nqm1 (C) and pfk1 (E) strains upon carbon starvation, and wild-type strain upon abruptly switching from glucose to no carbon (WT) versus to dihydroxyacetone (WT+DHA) as the sole carbon source (D). The x axis represents hours after carbon starvation, and the logarithmic y axis represents absolute intracellular concentration (mean±range of _N_=2 biological replicates).
Figure 7
The ribose-salvage pathway is essential for yeast’s survival in starvation. (A) Level of hallmark metabolites and energy charge in wild type, phm8 and pnp1/urh1 strains in starvation. The x axis represents hours after starvation, and the logarithmic y axis represents energy charge ([ATP]+0.5[ADP]/([ATP]+[ADP]+[AMP]) or absolute intracellular concentration (mean±range of _N_=2 biological replicates). (B and C) Growth and viability of wild type, phm8 and pnp1/urh1 strains in starvation. (D) Growth of wild type, phm8 and pnp1/urh1 strains in the switch from glucose to glycerol+ethanol. The x axis represents hours after starvation and the logarithmic y axis represents optical density (A600) in (B and D) and percentage of live cells calculated by dividing the number of colonies formed after starvation by the number of colonies formed before starvation in (C) (mean±range of _N_=2 biological replicates).
Figure 8
The accumulation of S7P in carbon starvation facilitates survival of subsequent oxidative stress. (A) Experimental design. Yeast cells growing on glucose were switched to no carbon media for 30 min. Thereafter, 20 mM H2O2 was added and metabolome analyzed by LC-MS. (B) Diagram of proposed reactions and their regulation. S7P accumulates during carbon starvation due to low level of glyceraldehyde-3-phosphate (GAP). Oxidative stress blocks GAP consumption via glycolysis by inhibiting GAPDH. This provides sufficient GAP to react with S7P, producing F6P via transaldolase. F6P is further converted to G6P which enters the oxidative PPP. The resulting NADPH is utilized for regeneration of reduced glutathione. 1,3-DPG, 1,3-diphosphoglycerate; GSSG, glutathione disulfide; GSH, reduced glutathione. (C and D) DHAP, S7P, G6P, and glutathione levels and NADPH/NADP+ ratio in wild type, phm8 and pnp1/urh1 strains in the experiment shown in (A) The x axis represents minutes after oxidative stress, and the y axis represents absolute intracellular concentration or ratio of intracellular concentration (mean±range of _N_=2 biological replicates). (E) Viability of wild type, phm8 and pnp1/urh1 strains in oxidative stress. The y axis represents percentage of survived cells calculated by dividing the number of colonies formed after oxidative stress by the number of colonies formed under the same starvation condition but without H2O2 treatment (mean±range of _N_=2 biological replicates).
Similar articles
- Pentose phosphates in nucleoside interconversion and catabolism.
Tozzi MG, Camici M, Mascia L, Sgarrella F, Ipata PL. Tozzi MG, et al. FEBS J. 2006 Mar;273(6):1089-101. doi: 10.1111/j.1742-4658.2006.05155.x. FEBS J. 2006. PMID: 16519676 Review. - Snf1 Phosphorylates Adenylate Cyclase and Negatively Regulates Protein Kinase A-dependent Transcription in Saccharomyces cerevisiae.
Nicastro R, Tripodi F, Gaggini M, Castoldi A, Reghellin V, Nonnis S, Tedeschi G, Coccetti P. Nicastro R, et al. J Biol Chem. 2015 Oct 9;290(41):24715-26. doi: 10.1074/jbc.M115.658005. Epub 2015 Aug 26. J Biol Chem. 2015. PMID: 26309257 Free PMC article. - On the role of GAPDH isoenzymes during pentose fermentation in engineered Saccharomyces cerevisiae.
Linck A, Vu XK, Essl C, Hiesl C, Boles E, Oreb M. Linck A, et al. FEMS Yeast Res. 2014 May;14(3):389-98. doi: 10.1111/1567-1364.12137. Epub 2014 Feb 13. FEMS Yeast Res. 2014. PMID: 24456572 - AMPK in Yeast: The SNF1 (Sucrose Non-fermenting 1) Protein Kinase Complex.
Sanz P, Viana R, Garcia-Gimeno MA. Sanz P, et al. Exp Suppl. 2016;107:353-374. doi: 10.1007/978-3-319-43589-3_14. Exp Suppl. 2016. PMID: 27812987 Review.
Cited by
- A fungal metabolic regulator underlies infectious synergism during Candida albicans-Staphylococcus aureus intra-abdominal co-infection.
Paul S, Todd OA, Eichelberger KR, Tkaczyk C, Sellman BR, Noverr MC, Cassat JE, Fidel PL Jr, Peters BM. Paul S, et al. Nat Commun. 2024 Jul 9;15(1):5746. doi: 10.1038/s41467-024-50058-w. Nat Commun. 2024. PMID: 38982056 Free PMC article. - Inosine is an alternative carbon source for CD8+-T-cell function under glucose restriction.
Wang T, Gnanaprakasam JNR, Chen X, Kang S, Xu X, Sun H, Liu L, Rodgers H, Miller E, Cassel TA, Sun Q, Vicente-Muñoz S, Warmoes MO, Lin P, Piedra-Quintero ZL, Guerau-de-Arellano M, Cassady KA, Zheng SG, Yang J, Lane AN, Song X, Fan TW, Wang R. Wang T, et al. Nat Metab. 2020 Jul;2(7):635-647. doi: 10.1038/s42255-020-0219-4. Epub 2020 Jun 15. Nat Metab. 2020. PMID: 32694789 Free PMC article. - Discovery and Functional Characterization of a Yeast Sugar Alcohol Phosphatase.
Xu YF, Lu W, Chen JC, Johnson SA, Gibney PA, Thomas DG, Brown G, May AL, Campagna SR, Yakunin AF, Botstein D, Rabinowitz JD. Xu YF, et al. ACS Chem Biol. 2018 Oct 19;13(10):3011-3020. doi: 10.1021/acschembio.8b00804. Epub 2018 Oct 4. ACS Chem Biol. 2018. PMID: 30240188 Free PMC article. - Reversing the directionality of reactions between non-oxidative pentose phosphate pathway and glycolytic pathway boosts mycosporine-like amino acid production in Saccharomyces cerevisiae.
Hengardi MT, Liang C, Madivannan K, Yang LK, Koduru L, Kanagasundaram Y, Arumugam P. Hengardi MT, et al. Microb Cell Fact. 2024 May 9;23(1):121. doi: 10.1186/s12934-024-02365-6. Microb Cell Fact. 2024. PMID: 38725068 Free PMC article. - Rapid discrimination between wild and cultivated Ophiocordyceps sinensis through comparative analysis of label-free SERS technique and mass spectrometry.
Liu QH, Tang JW, Ma ZW, Hong YX, Yuan Q, Chen J, Wen XR, Tang YR, Wang L. Liu QH, et al. Curr Res Food Sci. 2024 Aug 14;9:100820. doi: 10.1016/j.crfs.2024.100820. eCollection 2024. Curr Res Food Sci. 2024. PMID: 39263205 Free PMC article.
References
- Allen J, Davey HM, Broadhurst D, Heald JK, Rowland JJ, Oliver SG, Kell DB (2003) High-throughput classification of yeast mutants for functional genomics using metabolic footprinting. Nat Biotechnol 21: 692–696 - PubMed
- Baker CJ, Orlandi EW (1995) Active oxygen in plant pathogenesis. Ann Rev Phytopathol 33: 299–321 - PubMed
- Ben-Shem A, de Loubresse NG, Melnikov S, Jenner L, Yusupova G, Yusupov M (2011) The structure of the eukaryotic ribosome at 3.0 angstrom resolution. Science 334: 1524–1529 - PubMed
Publication types
MeSH terms
Substances
LinkOut - more resources
Full Text Sources
Other Literature Sources
Molecular Biology Databases


