Colocalization of different influenza viral RNA segments in the cytoplasm before viral budding as shown by single-molecule sensitivity FISH analysis - PubMed (original) (raw)
Colocalization of different influenza viral RNA segments in the cytoplasm before viral budding as shown by single-molecule sensitivity FISH analysis
Yi-ying Chou et al. PLoS Pathog. 2013.
Erratum in
- PLoS Pathog. 2013;9(7): doi/10.1371/annotation/8f53e7f2-2348-436f-b37e-a883a01e9bbd. Singer, Robert [corrected to Singer, Robert H]
Abstract
The Influenza A virus genome consists of eight negative sense, single-stranded RNA segments. Although it has been established that most virus particles contain a single copy of each of the eight viral RNAs, the packaging selection mechanism remains poorly understood. Influenza viral RNAs are synthesized in the nucleus, exported into the cytoplasm and travel to the plasma membrane where viral budding and genome packaging occurs. Due to the difficulties in analyzing associated vRNPs while preserving information about their positions within the cell, it has remained unclear how and where during cellular trafficking the viral RNAs of different segments encounter each other. Using a multicolor single-molecule sensitivity fluorescence in situ hybridization (smFISH) approach, we have quantitatively monitored the colocalization of pairs of influenza viral RNAs in infected cells. We found that upon infection, the viral RNAs from the incoming particles travel together until they reach the nucleus. The viral RNAs were then detected in distinct locations in the nucleus; they are then exported individually and initially remain separated in the cytoplasm. At later time points, the different viral RNA segments gather together in the cytoplasm in a microtubule independent manner. Viral RNAs of different identities colocalize at a high frequency when they are associated with Rab11 positive vesicles, suggesting that Rab11 positive organelles may facilitate the association of different viral RNAs. Using engineered influenza viruses lacking the expression of HA or M2 protein, we showed that these viral proteins are not essential for the colocalization of two different viral RNAs in the cytoplasm. In sum, our smFISH results reveal that the viral RNAs travel together in the cytoplasm before their arrival at the plasma membrane budding sites. This newly characterized step of the genome packaging process demonstrates the precise spatiotemporal regulation of the infection cycle.
Conflict of interest statement
The authors have declared that no competing interests exist.
Figures
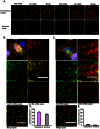
Figure 1. Single molecule sensitivity FISH and colocalization analyses of influenza viral RNAs.
(A) Images of MDCK cells infected with PR8 at MOI = 5 and fixed at 2 hpi (Maximum Intensity projections). The cells were probed against PB2 and NA vRNA using Cy5 labeled probes against the PB2 segment and Cy3 labeled probes against the NA segment. The upper panel shows the maximum projection of the fluorescent image stacks acquired in the Cy5 and Cy3 channels. The lower panel shows the 2D representation of the detected spots corresponding to the fluorescent images above. Each is represented as a square. Magnified images of the squared regions are shown on the right of each panel. The merge images of the detected spots show the spatial relationship between the Cy5 and Cy3 spots. Scale bar = 10 µm. (B) MDCK cells were infected with PR8 virus at MOI = 5 and fixed at 6 hpi (Maximum Intensity Projection). Two probe sets, 24 Cy3 labeled probes and 24 Cy5 labeled probes targeting different regions of the NA vRNA were used for hybridization. Top left: merged fluorescent image of DAPI, Cy3 and Cy5 channels is shown (scale bar = 10 µm). The magnified boxed area in each color channel and the corresponding detected spots are shown for comparison. Scale bar = 5 µm. (C) Colocalization analysis of influenza NA vRNA and cellular β-actin mRNA. MDCK cells were infected with PR8 virus at MOI = 5 and fixed at 8 hpi (Maximum Intensity Projection). The cells were hybridized with Cy5 labeled probes against the NA vRNAs, and Cy3 labeled probes against the host β-actin mRNA. The magnified boxed area in each color channel and the corresponding detected spots are shown for comparison. Scale bar = 10 µm in the low magnification image and 5 µm in the magnified images. (D) Colocalization efficiency of the Cy3 and Cy5 spots corresponding to the NA vRNA is shown. The colocalization efficiency is determined as the ratio of colocalized spots to NA spots. (E) Quantification of the colocalization efficiency of influenza NA vRNA and β-actin mRNA at 8 hpi. The colocalization efficiency is calculated by dividing the number of colocalized spots by the number of NA vRNA spots.
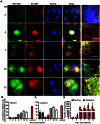
Figure 2. Colocalization of the PB2 and NA vRNAs in PR8 virus infected cells at different time points post infection.
MDCK cells were infected with PR8 virus at MOI = 5 and fixed at different time points post infection. Two-color FISH was then performed using Cy5 labeled probes against the PB2 vRNAs and Cy3 labeled probes against the NA vRNAs. (A) Fluorescent images representing the PB2 vRNA (Cy5), NA vRNA (Cy3) and nuclei (DAPI). Typical images taken at 2, 4, 7, 10 and 12 hpi are presented in each lane (Maximum Intensity Projections). Scale bar = 10 µm. Zoomed-in views of the boxed regions are shown in the rightmost panel of each lane. Scale bar = 5 µm. Image Contrast was adjusted to make cytoplasmic single molecules apparent. Due to their high vRNA density, some nuclei appear uniformly bright with these settings. (B) and (C) Quantification of the colocalization efficiency between PB2 and NA vRNAs in the nucleus (B) and the cytoplasm (C). The control colocalization efficiency represents the efficiency detected between Cy3 and Cy5 signals when the two differently labeled probe sets are both targeting the NA vRNA. (D) Average copy number per cell of PB2 and NA vRNAs in infected cells at different time points post infection. The average vRNA copy number per cell is calculated by dividing the sum of PB2 and NA vRNA molecules detected by the number of nuclei in the image. A total of five images containing more than 80 cells were analyzed for each time point.
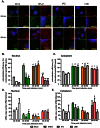
Figure 3. Colocalization of PB2 and NA vRNAs during the first hour of infection.
MDCK cells were incubated in medium containing DMSO, 20 mM ammonium chloride (NH4Cl), 100 µM importazole (IPZ) or 40 ng/ml leptomycin B (LMB) during PR8 virus infection at MOI = 100. Two-color FISH was performed at 20 min, 40 min and 60 min post infection with Cy5 probes targeting the PB2 vRNA and Cy3 probes targeting the NA vRNAs. (A) For each experimental condition, four Maximum Intensity Projections of the 3D fluorescent images are shown. The upper left image shows the merged image of the Cy5, Cy3 and DAPI channels. DAPI staining (blue) stains the nucleus of the cell. The enlarged images of the square area are shown on the upper right (NA, red spots), the lower left (PB2, green spots) and the lower right (merged image of the Cy3 and Cy5 signals with DAPI). Scale bar = 5 µm. (B) Colocalization efficiency of PB2 and NA in the nuclei of PR8 virus infected MDCK cells treated with different drugs at 20 min, 40 min and 60 min post infection. (C) Colocalization efficiency of PB2 and NA in the cytoplasm of PR8 virus infected MDCK cells treated with different drugs at 20, 40 and 60 min post infection. The average copy number of vRNAs (sum of PB2 and NA vRNAs) in the nucleus (D) and the cytoplasm (E) of cells treated with different drugs are shown. For each experimental condition more than 40 cells were analyzed. An unpaired student t-test was performed for each time point between experimental groups with the mock treated group. a: p value<0.05, b: p value<0.01, c: p value<0.001, d: p value<0.0001, ns: no significance.
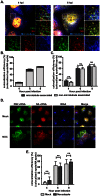
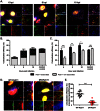
Figure 4. The colocalization of PB2 and NA vRNAs is independent of microtubules.
(A&B) MDCK cells infected with PR8 virus at MOI = 5 were subjected to immunofluorescence staining of the microtubules (blue) and two-color smFISH using Cy5- or Cy3-fluorophore labeled probes against the PB2 vRNAs (green) or the NA vRNAs (red), respectively. (A) Two-dimensional merged images of the microtubules, PB2 and NA vRNAs are shown for cells at 4 and 6 hpi (upper left image in each panel). The enlarged image of the boxed region is shown on the upper right corner; the enlarged images taken in each channel (bottom), and the merged image between the PB2 and NA vRNA spots are also shown (middle, right). Scale bar = 10 µm. (B) Quantification of the colocalization between PB2 and NA vRNAs is shown. The proportions of colocalized vRNAs associated with microtubules are represented in dark gray and the colocalized vRNAs that are not colocalized with microtubules are denoted in light gray. The percentages of colocalized vRNAs associated with microtubules are 24.5% at 4 hpi, 10.3% at 6hpi and 4.1% at 8hpi. Error bars represent standard deviation. (C) Quantification of the colocalization between PB2 and NA vRNAs that were associated with microtubules (dark gray) or not associated with microtubules (light gray). Error bars represent standard deviations. ns: un-paired t-test no significance. (D&E) MDCK cells were infected with PR8 virus at MOI = 5 and treated with nocodazole (NOC) at 1.5 hpi. (D) The treated cells were fixed at 8 hpi for smFISH analysis. Images of the Cy5 fluorescence (PB2 vRNAs), Cy3 fluorescence (NA vRNAs), Alexa 488 signal (cell membrane), and a merged image are shown for mock treated or NOC treated cells (Maximum Intensity Projections). Alexa-488 conjugated wheat germ agglutinin (WGA) stains the plasma membrane and Golgi apparatus in the cells. Scale bar = 5 µm. (E) Colocalization efficiency of PB2 and NA vRNAs in mock treated and NOC treated cells are shown. For each experimental condition, more than 50 cells were analyzed. Error bars denote standard deviation. ns: un-paired t-test no significance.
Figure 5. Rab11 is involved in the colocalization of PB2 and NA vRNAs.
(A–C) A549 cells are infected with PR8 virus at MOI = 5 and were fixed at 6, 8 and 10 hpi. Immunofluorescence staining was performed using anti-Rab11 antibody followed by two-color smFISH using Cy5-labeled PB2 probes and Cy3-labeled NA probes. (A) Merged fluorescent images of cells at 6, 8 and 10 hpi are shown on the upper left corners (Maximum Intensity Projection). For each panel, the boxed region is enlarged and shown on the upper right corner. The enlarged images of the PB2 vRNAs (green), NA vRNAs (red), and Rab11 (blue) are shown at the bottom, and the merged image of the PB2 and NA vRNA signals is shown on the middle right. Scale bar = 5 µm. (B) Colocalization efficiency of the PB2 and NA vRNA in the cytoplasm at 6, 8 and 10 hpi. The colocalized vRNAs that colocalize with Rab11 are represented in dark gray while the colocalized vRNAs that are not associated with Rab11 are shown in light gray. The percentages of colocalized vRNAs associated with Rab11 are 31.3% at 6hpi, 44.9% at 8hpi, 38.8% at 10hpi and 24% for random control. Error bars represent standard deviation. (C) Colocalization efficiency of PB2 and NA vRNAs associated with and not associated with Rab11 in cells at 6, 8 and 10 hpi. The random control represents the colocalization efficiency of PB2 and NA vRNA when the vRNAs were randomly classified into Rab11-associated and Rab11-non-associated groups. Error bars denote standard deviations. ***: t-test p value<0.001, **: t-test p-value<0.01 and *: t-test p value<0.05. (D&E) A549 cells were transfected with 1 µg of GFP-rab11-WT or GFP-rab11-DN and infected with PR8 virus at MOI = 5 at 24 hour post transfection. Two-color smFISH using Cy5 probes targeting the PB2 vRNAs and Cy3 probes targeting the NA vRNAs were performed at 8 hpi. (D) Images are shown for cells transfected with WT-Rab11 or DN-Rab11 (Maximum Intensity Projections). Magnified images of the boxed areas are shown: the separate images showing PB2 vRNAs (green), NA vRNAs (red) and GFP-tagged rab11 proteins (blue) are at the bottom; a merged image of the PB2 and NA vRNAs is shown at the middle right while the merged image of the three channels is located on the upper right corner of the panel. Scale bar = 5 µm. (E) Colocalization of PB2 and NA vRNAs in WT-Rab11 or DN-Rab11 expressing cells. The colocalization efficiency of PB2 and NA vRNAs were analyzed for individual cells that were detected with GFP signal (expressing the GFP-tagged rab11 proteins). The black dots symbolize the colocalization efficiency of vRNAs in WT-Rab11 transfected cells while the red squares symbolize the colocalization efficiency in DN-Rab11 transfected cells. The error bars represent standard deviations. ***: t-test p value<0.001.
Figure 6. The colocalization of PB2 and NA vRNAs is independent of expression of viral proteins HA and M2.
(A&B) MDCK cells were infected with either wild type PR8 (WT-PR8) or PR8-HA-GFP-HA viruses and fixed for two-color smFISH analysis against PB2 and NA vRNAs at 4, 6 and 8 hpi. (A) DAPI signal (blue), Cy5 fluorescence for PB2 vRNAs (green) and Cy3 fluorescence for NA vRNAs (red) for the cells infected with WT-PR8 and PR8-HA-GPF-HA viruses at 8 hpi (Maximum Intensity Projection). Scale bar = 10 µm. (B) Colocalization efficiency between PB2 and NA vRNAs in the cytoplasm of cells infected with either WT-RP8 or PR8-HA-GFP-HA viruses is shown. Error bars denote standard deviation. ns: t-test p value>0.05; no significance. (C&D) MDCK cells were infected with either PR8-WSN-M or PR8-WSN-ΔM2 at MOI = 5 and two-color FISH targeting the PB2 (Cy5 labeling) and NA (Cy3 labeling) vRNAs was performed at 6 and 8 hpi. (C) Fluorescent images of infected cells hybridized with Cy5 PB2 probes (green) and Cy3 NA probes (red) at 8 hpi (Maximum Intensity Projections). DAPI staining (blue) stains the nucleus of the cell. Scale bar = 10 µm. (D) Colocalization efficiency of PB2 and NA vRNAs in the cytoplasm of cells infected with PR8-WSN-M or PR8-WSN-ΔM2. Error bars denote standard deviations. ns: un-paired t-test no significance.
Figure 7. Proposed model for the disassembly and colocalization of different vRNA segments in an infected cell.
(1) An influenza virus particle enters the cell through the endocytic pathway. (2) Acidification of the endosome allows fusion of viral envelope with the endosomal membrane and the release of vRNPs into the cytosol. The vRNPs packaged in the virus particles remain tightly associated during their transport towards the nucleus. (3) Upon nuclear import, the associated vRNPs of different segments disassemble in the nucleus (Results in Figure 3) and (4) different vRNAs replicate in different areas of the nucleus and no segment-specific accumulation of vRNAs is observed (Results in Figure 2&3). (5) The newly synthesized vRNPs are exported into the cytoplasm individually and different segments are not associated with each other shortly after their nuclear export (Results in Figure 2&3). (6) During the vRNP trafficking to the plasma membrane, the vRNPs are loaded onto recycling endosomes through the association with Rab11 , , . The vRNPs of different segments then start to colocalize with each other and travel together towards the apical plasma membrane as a pre-formed complex of eight different vRNPs. (7) As the complex reaches the plasma membrane, the eight different vRNPs are then packaged as a whole into the budding virions.
Similar articles
- Intracellular Colocalization of Influenza Viral RNA and Rab11A Is Dependent upon Microtubule Filaments.
Nturibi E, Bhagwat AR, Coburn S, Myerburg MM, Lakdawala SS. Nturibi E, et al. J Virol. 2017 Sep 12;91(19):e01179-17. doi: 10.1128/JVI.01179-17. Print 2017 Oct 1. J Virol. 2017. PMID: 28724771 Free PMC article. - Selective incorporation of vRNP into influenza A virions determined by its specific interaction with M1 protein.
Chaimayo C, Hayashi T, Underwood A, Hodges E, Takimoto T. Chaimayo C, et al. Virology. 2017 May;505:23-32. doi: 10.1016/j.virol.2017.02.008. Epub 2017 Feb 17. Virology. 2017. PMID: 28219018 Free PMC article. - Moving On Out: Transport and Packaging of Influenza Viral RNA into Virions.
Lakdawala SS, Fodor E, Subbarao K. Lakdawala SS, et al. Annu Rev Virol. 2016 Sep 29;3(1):411-427. doi: 10.1146/annurev-virology-110615-042345. Annu Rev Virol. 2016. PMID: 27741407 Review. - Lateral Organization of Influenza Virus Proteins in the Budozone Region of the Plasma Membrane.
Leser GP, Lamb RA. Leser GP, et al. J Virol. 2017 Apr 13;91(9):e02104-16. doi: 10.1128/JVI.02104-16. Print 2017 May 1. J Virol. 2017. PMID: 28202765 Free PMC article. - Experimental Approaches to Study Genome Packaging of Influenza A Viruses.
Isel C, Munier S, Naffakh N. Isel C, et al. Viruses. 2016 Aug 9;8(8):218. doi: 10.3390/v8080218. Viruses. 2016. PMID: 27517951 Free PMC article. Review.
Cited by
- Single-Molecule FISH Reveals Non-selective Packaging of Rift Valley Fever Virus Genome Segments.
Wichgers Schreur PJ, Kortekaas J. Wichgers Schreur PJ, et al. PLoS Pathog. 2016 Aug 22;12(8):e1005800. doi: 10.1371/journal.ppat.1005800. eCollection 2016 Aug. PLoS Pathog. 2016. PMID: 27548280 Free PMC article. - Three-Dimensional Simultaneous Imaging of Nucleic Acids and Proteins During Influenza Virus Infection in Single Cells Using Confocal Microscopy.
Manivanh R, Lakdawala SS, Jones JE. Manivanh R, et al. Methods Mol Biol. 2022;2440:41-56. doi: 10.1007/978-1-0716-2051-9_2. Methods Mol Biol. 2022. PMID: 35218531 - Brief update on endocytosis of nanomedicines.
Patel S, Kim J, Herrera M, Mukherjee A, Kabanov AV, Sahay G. Patel S, et al. Adv Drug Deliv Rev. 2019 Apr;144:90-111. doi: 10.1016/j.addr.2019.08.004. Epub 2019 Aug 13. Adv Drug Deliv Rev. 2019. PMID: 31419450 Free PMC article. Review. - Real-time dissection of dynamic uncoating of individual influenza viruses.
Qin C, Li W, Li Q, Yin W, Zhang X, Zhang Z, Zhang XE, Cui Z. Qin C, et al. Proc Natl Acad Sci U S A. 2019 Feb 12;116(7):2577-2582. doi: 10.1073/pnas.1812632116. Epub 2019 Jan 9. Proc Natl Acad Sci U S A. 2019. PMID: 30626642 Free PMC article. - A Comprehensive Review on the Interaction Between the Host GTPase Rab11 and Influenza A Virus.
Amorim MJ. Amorim MJ. Front Cell Dev Biol. 2019 Jan 9;6:176. doi: 10.3389/fcell.2018.00176. eCollection 2018. Front Cell Dev Biol. 2019. PMID: 30687703 Free PMC article. Review.
References
- Palese P, Shaw ML (2007) Orthomyxoviridae: The viruses and their replication. In: Knipe DM, Howley PM, editors. Fields Virology. Philadelphia: Lippincott Williams & Wilkins. pp. 1648–1689.
Publication types
MeSH terms
Substances
Grants and funding
- GM86217/GM/NIGMS NIH HHS/United States
- GM84364/GM/NIGMS NIH HHS/United States
- R01 GM086217/GM/NIGMS NIH HHS/United States
- HHSN266200700010C/AI/NIAID NIH HHS/United States
- R01 GM084364/GM/NIGMS NIH HHS/United States
LinkOut - more resources
Full Text Sources
Other Literature Sources
Research Materials
