MicroRNA-155 confers encephalogenic potential to Th17 cells by promoting effector gene expression - PubMed (original) (raw)
MicroRNA-155 confers encephalogenic potential to Th17 cells by promoting effector gene expression
Ruozhen Hu et al. J Immunol. 2013.
Abstract
Th17 cells are central to the pathogenesis of autoimmune disease, and recently specific noncoding microRNAs have been shown to regulate their development. However, it remains unclear whether microRNAs are also involved in modulating Th17 cell effector functions. Consequently, we examined the role of miR-155 in differentiated Th17 cells during their induction of experimental autoimmune encephalomyelitis. Using adoptive transfer experiments, we found that highly purified, myelin oligodendrocyte glycoprotein Ag-specific Th17 cells lacking miR-155 were defective in their capacity to cause experimental autoimmune encephalomyelitis. Gene expression profiling of purified miR-155(-/-)IL-17F(+) Th17 cells identified a subset of effector genes that are dependent on miR-155 for their proper expression through a mechanism involving repression of the transcription factor Ets1. Among the genes reduced in the absence of miR-155 was IL-23R, resulting in miR-155(-/-) Th17 cells being hyporesponsive to IL-23. Taken together, our study demonstrates a critical role for miR-155 in Th17 cells as they unleash autoimmune inflammation and finds that this occurs through a signaling network involving miR-155, Ets1, and the clinically relevant IL-23-IL-23R pathway.
Figures
Figure 1. Creation of a miR-155−/− IL-17F RFP reporter mouse strain
(A) Generation of miR-155+/+ and miR-155−/− IL-17F RFP reporter mouse strains. Left: Schematic diagram showing the mouse cross. Right: Genotyping results demonstrating completion of the desired mouse strains. (B) Expression of IL-17F mRNA by CD4+ T cells from the indicated genotypes cultured under Th17 cell-skewing conditions was assayed by qPCR over a timecourse. (C-E) CD4+ T cells were isolated from miR-155+/+ and miR-155−/− CD4+ IL17F RFP+/− mice and cultured in vitro under different Th17 cell-skewing conditions. (C) After 72 hours, expression of RFP was assayed by FACS. (D) Average percentage of IL-17F+ cells in different in vitro culture conditions (n=4). (E) ELISA of IL-17A from in vitro cultured CD4+ T cells. Error bars represent +/− SEM. * denotes a p value of <0.05.
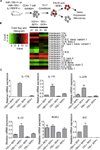
Figure 2. miR-155 regulates Th17-related genes in purified IL17F+ Th17 cells
(A) Schematic diagram of the experimental design. (B) Heatmap of the differentially expressed interleukin genes in miR-155+/+ versus miR-155−/− IL-17F+ Th17 cells (n=2). The colors represent normalized fluorescence values on a log scale. The color key is next to the heatmap. (C) Relative expression levels of bic ncRNA and IL-17A, IL-17F, IL-23R, RORgT and IL-22 mRNA in FACS sorted T cells from (B) were assayed by qPCR (n=2). Error bars represent +/− SEM.
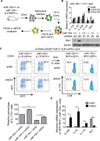
Figure 3. miR-155 directly targets Ets1 in Th17 cells
(A) Predicted transcription factors targeted by miR-155 according to an Ingenuity transcription factor analysis of the microarray data from Fig. 2. (B) Conserved miR-155 binding sites in the Ets1 3’UTR, and predicted interaction with the conserved 8-mer seed found within miR-155. (C) Luciferase assays were performed and found that the Ets1 3’ UTR has a functional miR-155 target site. The Picalm 3’ UTR and the miR-155 2-mer were included as positive controls, and the TRAF6 3’ UTR was a negative control. (D) miR-155+/+ or miR-155−/− IL-17F RFP+/− CD4+ T cells were cultured under Th17 skewing conditions. 72 hours later, Ets1 protein levels were assayed by Western blotting (left), which was quantified for multiple samples (right) (n=5). Error bars represent +/− SEM. * denotes a p value of <0.05.
Figure 4. Ets1 is a functionally relevant target of miR-155 in Th17 cells
(A) Schematic of experimental design. (B) miR-155+/+ or miR-155−/− IL-17F RFP+/− CD4+ T cells were isolated and infected with a control (NC) or Ets1 shRNA expressing retrovirus. After culturing under Th17 cell-skewing conditions for 72 hrs, RNA or protein was extracted and expression of the indicated Th17-related genes were analyzed by qPCR (Upper panel) or Ets1 by Western blotting (Lower panel). (C) miR-155+/+ or miR-155−/−RFP+GFP+ T cells were sorted by FACS and subjected to intracellular staining for IL-17A. (D) Graph of the average relative percentage of IL-17A+ cells in sorted miR-155+/+ or miR-155−/− RFP+GFP+ cells transduced with the control or Ets1 shRNA expressing retroviral vector (n=4, 2 independent experiments). (E) Expression of Th17 cell effector genes in sorted miR-155−/− RFP+GFP+ cells transduced with the control or Ets1 shRNA expressing retroviral vector were analyzed by qPCR (n=4). Error bars represent +/− SEM. * denotes a p value of <0.05.
Figure 5. miR-155 promotes the function of IL-17F+ 2d2 TCR Tg+ CD4+ T cells during EAE
(A) Genotyping results confirming the creation of miR-155+/+ or miR-155−/− IL-17F+/− 2D2 TCR Tg+ mice. (B) Schematic of the experimental design. (C-D) CD4+ T cells were isolated from miR-155+/+ and miR-155−/− IL-17F RFP+/− 2D2 TCR Tg+ mice and cultured under Th17 cell-skewing conditions. 72 hrs later, IL-17F RFP+ 2D2 TCR Tg+ CD4+ Th17 cells were sorted by FACS and equal numbers of miR-155+/+ or miR-155−/− cells were injected into Rag1−/− mice. EAE was induced in both groups by immunizing with 100 µg of the MOG35–55 peptide. (C) The disease severity was scored regularly based on clinical symptoms (n=10). (D) Disease incidence was assessed for each group. Error bars represent +/− SEM. * denotes a p value of <0.05.
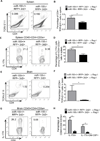
Figure 6. miR-155 promotes brain infiltration and cytokine production by IL-17F+ 2d2 TCR Tg+ CD4+ T cells during EAE
CD4+ T cells were isolated from the spleens and brains of mice following experiments as described in Figure 5, and (A–H) FACS analysis of the splenocytes (A–D) or brain cells (E–H) was performed. (A) and (E) show the percentage of transferred miR-155+/+ and miR-155−/− IL-17F+ TCR Vb11+ CD4+ T cells in each organ, while (B) and (F) show data for multiple mice in each group. (C) and (G) are representative FACS plots of IL-17A expression by the recovered T cells, and (D) and (H) show data for multiple mice. The percentage of brain IL-17A+GM-CSF+ cells are also shown in (H). n=5 for the miR-155+/+ groups and n=8 for the miR-155−/− groups. Error bars represent +/− SEM. * denotes a p value of <0.05.
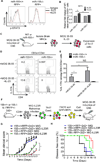
Figure 7. miR-155 promotes IL-23 signaling by IL-17F+ Th17 cells
CD4+ T cells were isolated from miR-155+/+ and miR-155−/− IL-17F RFP+/− mice and cultured in Th17 condition for 72 hrs. RFP+ IL-17F+ cells were sorted by FACS and re-plated in 96 well plates followed by restimulation with IL-23 or iL-6 for 20 min. Cells were subjected to p-STAT3 staining. (A) Representing FACS plot of p-STAT3 staining after IL-23 restimulation. Black lines represent cells without cytokine treatment and red lines represent cells with IL-23. (B) Graphs of the mean fluorescence intensity (MFI) of p-STAT3 (n=4) before and after IL-23 treatment. (C) Schematic of the experimental design. (D) Representative FACS plots of IL-17A expression by MOG35–55 restimulated CD4+ T cells from the brains Wt and miR-155−/− EAE mice with and without IL-23 treatment. (E) Data from (D) are shown graphically for multiple mice. (F) Schematic of the experimental design. CD4+ T cells were isolated from miR-155+/+ and miR-155−/− IL-17F RFP+/− 2D2 TCR Tg+ mice and infected with a control (MIG) or MIG-IL23R expressing retrovirus. After culturing under Th17 cell-skewing conditions for 72 hrs, miR-155+/+ or miR-155−/− IL-17F+ 2D2 TCR Tg+ GFP+ CD4+ T cells were sorted by FACS and equal numbers injected into Rag1−/− mice. (G) EAE was induced following the adoptive cell transfer, and disease severity was scored regularly based on clinical symptoms (n=5 for the miR-155+/+ groups and n=8 for the miR-155−/− groups). (H) Disease incidence was also analyzed for each group (n=5 for miR-155+/+ groups and n=8 for miR-155−/− groups). Error bars represent +/− SEM. * denotes a p value of <0.05.
Similar articles
- MicroRNA-301a regulation of a T-helper 17 immune response controls autoimmune demyelination.
Mycko MP, Cichalewska M, Machlanska A, Cwiklinska H, Mariasiewicz M, Selmaj KW. Mycko MP, et al. Proc Natl Acad Sci U S A. 2012 May 15;109(20):E1248-57. doi: 10.1073/pnas.1114325109. Epub 2012 Apr 18. Proc Natl Acad Sci U S A. 2012. PMID: 22517757 Free PMC article. - MicroRNA-15b Suppresses Th17 Differentiation and Is Associated with Pathogenesis of Multiple Sclerosis by Targeting _O_-GlcNAc Transferase.
Liu R, Ma X, Chen L, Yang Y, Zeng Y, Gao J, Jiang W, Zhang F, Li D, Han B, Han R, Qiu R, Huang W, Wang Y, Hao J. Liu R, et al. J Immunol. 2017 Apr 1;198(7):2626-2639. doi: 10.4049/jimmunol.1601727. Epub 2017 Feb 22. J Immunol. 2017. PMID: 28228555 - miR-17-92 cluster targets phosphatase and tensin homology and Ikaros Family Zinc Finger 4 to promote TH17-mediated inflammation.
Liu SQ, Jiang S, Li C, Zhang B, Li QJ. Liu SQ, et al. J Biol Chem. 2014 May 2;289(18):12446-56. doi: 10.1074/jbc.M114.550723. Epub 2014 Mar 18. J Biol Chem. 2014. PMID: 24644282 Free PMC article. - The MicroRNA miR-22 Represses Th17 Cell Pathogenicity by Targeting PTEN-Regulated Pathways.
Wang L, Qiu R, Zhang Z, Han Z, Yao C, Hou G, Dai D, Jin W, Tang Y, Yu X, Shen N. Wang L, et al. Immunohorizons. 2020 Jun 9;4(6):308-318. doi: 10.4049/immunohorizons.2000008. Immunohorizons. 2020. PMID: 32518131
Cited by
- The Multiple Roles of Hepatitis B Virus X Protein (HBx) Dysregulated MicroRNA in Hepatitis B Virus-Associated Hepatocellular Carcinoma (HBV-HCC) and Immune Pathways.
Sartorius K, Swadling L, An P, Makarova J, Winkler C, Chuturgoon A, Kramvis A. Sartorius K, et al. Viruses. 2020 Jul 10;12(7):746. doi: 10.3390/v12070746. Viruses. 2020. PMID: 32664401 Free PMC article. Review. - miR-155 deficiency protects mice from experimental colitis by reducing T helper type 1/type 17 responses.
Singh UP, Murphy AE, Enos RT, Shamran HA, Singh NP, Guan H, Hegde VL, Fan D, Price RL, Taub DD, Mishra MK, Nagarkatti M, Nagarkatti PS. Singh UP, et al. Immunology. 2014 Nov;143(3):478-89. doi: 10.1111/imm.12328. Immunology. 2014. PMID: 24891206 Free PMC article. - Physiological roles of miR-155.
Mashima R. Mashima R. Immunology. 2015 Jul;145(3):323-33. doi: 10.1111/imm.12468. Epub 2015 May 19. Immunology. 2015. PMID: 25829072 Free PMC article. Review. - MicroRNA223 promotes pathogenic T-cell development and autoimmune inflammation in central nervous system in mice.
Satoorian T, Li B, Tang X, Xiao J, Xing W, Shi W, Lau KH, Baylink DJ, Qin X. Satoorian T, et al. Immunology. 2016 Aug;148(4):326-38. doi: 10.1111/imm.12611. Epub 2016 Jun 29. Immunology. 2016. PMID: 27083389 Free PMC article. - miRNA and antisense oligonucleotide-based α-synuclein targeting as disease-modifying therapeutics in Parkinson's disease.
Suvarna V, Deshmukh K, Murahari M. Suvarna V, et al. Front Pharmacol. 2022 Nov 15;13:1034072. doi: 10.3389/fphar.2022.1034072. eCollection 2022. Front Pharmacol. 2022. PMID: 36506536 Free PMC article. Review.
References
- Mackay IR. Travels and travails of autoimmunity: a historical journey from discovery to rediscovery. Autoimmun Rev. 2010;9:A251–A258. - PubMed
- Oukka M. Th17 cells in immunity and autoimmunity. Ann Rheum Dis. 2008;67(67 Suppl 3):ii26–ii29. - PubMed
- Bettelli E, Carrier Y, Gao W, Korn T, Strom TB, Oukka M, Weiner HL, Kuchroo VK. Reciprocal developmental pathways for the generation of pathogenic effector TH17 and regulatory T cells. Nature. 2006;441:235–238. - PubMed
- Mangan PR, Harrington LE, O'Quinn DB, Helms WS, Bullard DC, Elson CO, Hatton RD, Wahl SM, Schoeb TR, Weaver CT. Transforming growth factor-beta induces development of the T(H)17 lineage. Nature. 2006;441:231–234. - PubMed
Publication types
MeSH terms
Substances
LinkOut - more resources
Full Text Sources
Other Literature Sources
Molecular Biology Databases
Research Materials
Miscellaneous


