Structural insights into Aβ42 oligomers using site-directed spin labeling - PubMed (original) (raw)
Structural insights into Aβ42 oligomers using site-directed spin labeling
Lei Gu et al. J Biol Chem. 2013.
Abstract
Oligomerization of the 42-residue peptide Aβ42 plays a key role in the pathogenesis of Alzheimer disease. Despite great academic and medical interest, the structures of these oligomers have not been well characterized. Site-directed spin labeling combined with electron paramagnetic resonance spectroscopy is a powerful approach for studying structurally ill-defined systems, but its application in amyloid oligomer structure study has not been systematically explored. Here we report a comprehensive structural study on a toxic Aβ42 oligomer, called globulomer, using site-directed spin labeling complemented by other techniques. Transmission electron microscopy shows that these oligomers are globular structures with diameters of ∼7-8 nm. Circular dichroism shows primarily β-structures. X-ray powder diffraction suggests a highly ordered intrasheet hydrogen-bonding network and a heterogeneous intersheet packing. Residue-level mobility analysis on spin labels introduced at 14 different positions shows a structured state and a disordered state at all labeling sites. Side chain mobility analysis suggests that structural order increases from N- to C-terminal regions. Intermolecular distance measurements at 14 residue positions suggest that C-terminal residues Gly-29-Val-40 form a tightly packed core with intermolecular distances in a narrow range of 11.5-12.5 Å. These intermolecular distances rule out the existence of fibril-like parallel in-register β-structures and strongly suggest an antiparallel β-sheet arrangement in Aβ42 globulomers.
Keywords: Alzheimer Disease; Amyloid; EPR; ESR; Electron Paramagnetic Resonance; Protein Aggregation; Protein Misfolding; Protein Self-assembly; Spin Labeling.
Figures
FIGURE 1.
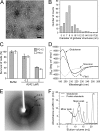
Characterization of wild-type Aβ42 globulomers. A, TEM image of Aβ42 globulomers. B, diameters of Aβ42 globulomers from TEM studies. C, survival of PC-12 and HeLa cells in the presence of Aβ42 globulomers using MTT-based cell viability assay. The buffer control has the exact composition as in the final step of globulomer preparation. Error bars indicate S.D. D, CD measurement of Aβ42 globulomers, fibrils, and monomers. A major negative peak at 216–218 nm suggests that Aβ42 globulomers contain predominantly β-structures. E, x-ray powder diffraction of lyophilized Aβ42 globulomers. F, analytical size exclusion chromatography profile of Aβ42 globulomers. Solid trace, globulomers; dotted trace, protein standards. The molecular masses of protein standards are: peak 1, thyroglobulin, 670 kDa; peak 2, bovine γ-globulin, 158 kDa; peak 3, chicken ovalbumin, 44 kDa; peak 4, equine myoglobin, 17 kDa; peak 5, vitamin B12, 1.35 kDa.
FIGURE 2.
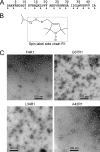
Globulomers of spin-labeled Aβ42. A, amino acid sequence of Aβ42 with spin labeling positions shown with arrowheads. B, structure of the spin label side chain R1 used in this work. C, TEM images of four representative spin-labeled Aβ42 globulomers show globular structures as major species.
FIGURE 3.
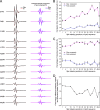
Residue-specific EPR mobility analysis for spin-labeled Aβ42 globulomers. A, the experimental EPR spectra of 25% labeled Aβ42 globulomers, which consist of spin-labeled and wild-type Aβ42 at 1:3 molar ratio, are shown in black. The best nonlinear least squares fits from spectral simulations are shown in red. All the fits contain two spectral components: a slow component (magenta) and a fast component (blue). B, plot of correlation time for the slow and fast components obtained from spectral simulations. C, plot of the populations of the fast and slow components from spectral simulations. D, residue-level local structural stability calculated using the relative populations of the slow (for structured state) and fast (for disordered state) components. Error bars in B and C indicate fitting errors.
FIGURE 4.
Temporal stability of Aβ42 globulomers. A, EPR spectra of Aβ42 L34R1 globulomers at room temperature in preparation buffer (5 m
m
phosphate, pH 7.4, 35 m
m
NaCl, 2% DMSO, and 0.05% SDS). B, EPR spectra of Aβ42 L34R1 globulomers at room temperature after 10-fold dilution to cell culture medium, which is ATCC-formulated RPMI 1640 medium with 10% heat-inactivated horse serum and 5% fetal bovine serum. Dotted line was drawn to aid comparison of different spectra.
FIGURE 5.
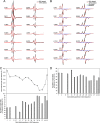
Intermolecular distance measurements for spin-labeled Aβ42 globulomers. A, EPR spectra of 100% labeled oligomers at room temperature show significantly reduced spectral amplitude than 25% labeled samples, suggesting intermolecular dipolar interactions. B, EPR spectra of 25 and 100% labeled Aβ42 globulomers at 170 K. Interspin distances are obtained by simulating the 100% labeled spectra. The residual is the difference between simulated spectra and 100% labeled spectra. C, plot of intermolecular distance between spin labels and the percentage of spin labels at measured distances. D, plot of the populations of spin labels at >20 Å. Error bars in C and D indicate fitting errors.
FIGURE 6.
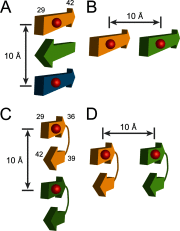
Potential structural origins of measured intermolecular distances for C-terminal residues Gly-29–Ala-42. A–D, different β-strand organizations giving rise to the measured distances at ∼10 Å. Red balls represent spin labels. Numbers in A and C show approximate residue positions for each β-strand segment. Each model consists of only a minimum repeating unit, which can be extended in either hydrogen-bonding or side chain directions.
FIGURE 7.
EPR spectra of Aβ42 L34R1 preglobulomers. A, preglobulomers prepared in 0.2% SDS. B, preglobulomers prepared in 1.5% SDS.
FIGURE 8.
EPR analysis can resolve structural heterogeneity in Aβ oligomers. A, spectral subtraction to isolate the spectral component of interest. B, spectral simulations to reveal multiple structural states. C, distance analysis to reveal both the distance and the relative population of spin labels at the measured distance.
Similar articles
- EPR Studies of Aβ42 Oligomers Indicate a Parallel In-Register β-Sheet Structure.
Jang C, Portugal Barron D, Duo L, Ma C, Seabaugh H, Guo Z. Jang C, et al. ACS Chem Neurosci. 2024 Jan 3;15(1):86-97. doi: 10.1021/acschemneuro.3c00364. Epub 2023 Dec 18. ACS Chem Neurosci. 2024. PMID: 38109787 Free PMC article. - Segmental structural dynamics in Aβ42 globulomers.
Yoon A, Zhen J, Guo Z. Yoon A, et al. Biochem Biophys Res Commun. 2021 Mar 19;545:119-124. doi: 10.1016/j.bbrc.2021.01.081. Epub 2021 Feb 3. Biochem Biophys Res Commun. 2021. PMID: 33548624 Free PMC article. - Antiparallel triple-strand architecture for prefibrillar Aβ42 oligomers.
Gu L, Liu C, Stroud JC, Ngo S, Jiang L, Guo Z. Gu L, et al. J Biol Chem. 2014 Sep 26;289(39):27300-27313. doi: 10.1074/jbc.M114.569004. Epub 2014 Aug 12. J Biol Chem. 2014. PMID: 25118290 Free PMC article. - Fibrils with parallel in-register structure constitute a major class of amyloid fibrils: molecular insights from electron paramagnetic resonance spectroscopy.
Margittai M, Langen R. Margittai M, et al. Q Rev Biophys. 2008 Aug-Nov;41(3-4):265-97. doi: 10.1017/S0033583508004733. Q Rev Biophys. 2008. PMID: 19079806 Review. - Elucidating the design principles of photosynthetic electron-transfer proteins by site-directed spin labeling EPR spectroscopy.
Ishara Silva K, Jagannathan B, Golbeck JH, Lakshmi KV. Ishara Silva K, et al. Biochim Biophys Acta. 2016 May;1857(5):548-556. doi: 10.1016/j.bbabio.2015.08.009. Epub 2015 Sep 1. Biochim Biophys Acta. 2016. PMID: 26334844 Review.
Cited by
- Controlling the Oligomerization State of Aβ-Derived Peptides with Light.
Salveson PJ, Haerianardakani S, Thuy-Boun A, Kreutzer AG, Nowick JS. Salveson PJ, et al. J Am Chem Soc. 2018 May 2;140(17):5842-5852. doi: 10.1021/jacs.8b02658. Epub 2018 Apr 20. J Am Chem Soc. 2018. PMID: 29627987 Free PMC article. - Amyloid β Oligomeric Species Present in the Lag Phase of Amyloid Formation.
Wolff M, Unuchek D, Zhang B, Gordeliy V, Willbold D, Nagel-Steger L. Wolff M, et al. PLoS One. 2015 May 29;10(5):e0127865. doi: 10.1371/journal.pone.0127865. eCollection 2015. PLoS One. 2015. PMID: 26024352 Free PMC article. - Distinguishing the Effect on the Rate and Yield of Aβ42 Aggregation by Green Tea Polyphenol EGCG.
Park G, Xue C, Wang H, Guo Z. Park G, et al. ACS Omega. 2020 Aug 21;5(34):21497-21505. doi: 10.1021/acsomega.0c02063. eCollection 2020 Sep 1. ACS Omega. 2020. PMID: 32905372 Free PMC article. - Evidence for a Strong Relationship between the Cytotoxicity and Intracellular Location of β-Amyloid.
Haque MA, Hossain MS, Bilkis T, Islam MI, Park IS. Haque MA, et al. Life (Basel). 2022 Apr 13;12(4):577. doi: 10.3390/life12040577. Life (Basel). 2022. PMID: 35455068 Free PMC article. - Effect of metals on kinetic pathways of amyloid-β aggregation.
Hane F, Leonenko Z. Hane F, et al. Biomolecules. 2014 Jan 10;4(1):101-16. doi: 10.3390/biom4010101. Biomolecules. 2014. PMID: 24970207 Free PMC article. Review.
References
- De Strooper B. (2010) Proteases and proteolysis in Alzheimer disease: a multifactorial view on the disease process. Physiol. Rev. 90, 465–494 - PubMed
- Iwatsubo T., Odaka A., Suzuki N., Mizusawa H., Nukina N., Ihara Y. (1994) Visualization of Aβ42(43) and Aβ40 in senile plaques with end-specific Aβ monoclonals: Evidence that an initially deposited species is Aβ42(43). Neuron 13, 45–53 - PubMed
- Hardy J., Selkoe D. J. (2002) The amyloid hypothesis of Alzheimer's disease: Progress and problems on the road to therapeutics. Science 297, 353–356 - PubMed
- McLean C. A., Cherny R. A., Fraser F. W., Fuller S. J., Smith M. J., Beyreuther K., Bush A. I., Masters C. L. (1999) Soluble pool of Aβ amyloid as a determinant of severity of neurodegeneration in Alzheimer's disease. Ann. Neurol. 46, 860–866 - PubMed
Publication types
MeSH terms
Substances
LinkOut - more resources
Full Text Sources
Other Literature Sources
Miscellaneous
