Reintroductions and genetic introgression from domestic pigs have shaped the genetic population structure of Northwest European wild boar - PubMed (original) (raw)
Reintroductions and genetic introgression from domestic pigs have shaped the genetic population structure of Northwest European wild boar
Daniel J Goedbloed et al. BMC Genet. 2013.
Abstract
Background: Population genetic studies focus on natural dispersal and isolation by landscape barriers as the main drivers of genetic population structure. However, anthropogenic factors such as reintroductions, translocations and wild x domestic hybridization may also have strong effects on genetic population structure. In this study we genotyped 351 Single Nucleotide Polymorphism markers evenly spread across the genome in 645 wild boar (Sus scrofa) from Northwest Europe to evaluate determinants of genetic population structure.
Results: We show that wild boar genetic population structure is influenced by historical reintroductions and by genetic introgression from domestic pigs. Six genetically distinct and geographically coherent wild boar clusters were identified in the Netherlands and Western Germany. The Dutch Veluwe cluster is known to be reintroduced, and three adjacent Dutch and German clusters are suspected to be a result of reintroduction, based on clustering results, low levels of heterozygosity and relatively high genetic distances to nearby populations. Recent wild x domestic hybrids were found geographically widespread across clusters and at low frequencies (average 3.9%). The relationship between pairwise kinship coefficients and geographic distance showed male-biased dispersal at the population genetic level.
Conclusions: Our results demonstrate that wildlife and landscape management by humans are shaping the genetic diversity of an iconic wildlife species. Historical reintroductions, translocation and recent restocking activities with farmed wild boar have all influenced wild boar genetic population structure. The current trend of wild boar population growth and range expansion has recently led to a number of contact zones between clusters, and further admixture between the different wild boar clusters is to be expected.
Figures
Figure 1
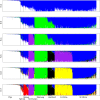
Population assignment proportions per individual based on results from structure for K = 2-7. Recent wild x domestic hybrids, sampled in the field as wild boar, are delimited by vertical lines. Results for K = 5 were not ambiguous across runs. Majority rule results (n = 10) are presented here, but the inclusion of E-Rhine in Kirchhellen at K = 5 is not fully supported, as various alternative clustering patterns were also inferred. Evanno’s method favoured optimal partitioning at K = 7 (see Additional file 5).
Figure 2
PCA plot of the wild boar and a sample of domestic pigs, indicating genetic variation along the first two eigenvectors. Colours correspond to Figure 1. The 25 recent wild boar x domestic pig hybrids identified by
structure
(threshold assignment proportion 0.25) are indicated in dark grey and four additional advanced generation hybrids with introgressed pig alleles identified in a previous study [21] are indicated in light grey.
Figure 3
PCA plots indicating the first four eigenvectors of the wild boar data only. Colours indicate the six clusters identified by
structure
. Putative hybrids are not indicated in this figure. Eigenvectors 1–4 explain 43% of variance in the dataset.
Figure 4
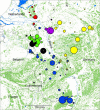
Map of the study area indicating identified clusters. Country borders are indicated by black lines, forests are indicated in soft green and inland water features in light blue. Dots indicate wild boar sampling sites. The size of the dot is relative to the sample size. The colours indicate genetic clustering by
structure
and correspond to other Figures. Hybrids identified by
structure
(domestic cluster assignment proportion >0.25) are indicated in grey.
Figure 5
NeighborNetwork of six representative samples per wild boar cluster and one sample per domestic pig breed. The number of samples was chosen for optimal balance in information content and clarity of the figure. Distances are based on the uncorrected P (or Hamming) method.
Figure 6
Pairwise kinship coefficients of both sexes versus geographic distance. Results are based on local polynomial regression analysis. Females show relative site fidelity at pairwise distances less than 25 kilometres, and males show higher kinship coefficients at distances between 25 and 150 kilometres, indicating higher dispersal rates.
Similar articles
- Genome-wide single nucleotide polymorphism analysis reveals recent genetic introgression from domestic pigs into Northwest European wild boar populations.
Goedbloed DJ, Megens HJ, Van Hooft P, Herrero-Medrano JM, Lutz W, Alexandri P, Crooijmans RP, Groenen M, Van Wieren SE, Ydenberg RC, Prins HH. Goedbloed DJ, et al. Mol Ecol. 2013 Feb;22(3):856-66. doi: 10.1111/j.1365-294X.2012.05670.x. Epub 2012 Jun 26. Mol Ecol. 2013. PMID: 22731769 - Mixed ancestry from wild and domestic lineages contributes to the rapid expansion of invasive feral swine.
Smyser TJ, Tabak MA, Slootmaker C, Robeson MS 2nd, Miller RS, Bosse M, Megens HJ, Groenen MAM, Paiva SR, de Faria DA, Blackburn HD, Schmit BS, Piaggio AJ. Smyser TJ, et al. Mol Ecol. 2020 Mar;29(6):1103-1119. doi: 10.1111/mec.15392. Epub 2020 Mar 9. Mol Ecol. 2020. PMID: 32080922 - [Cytogenetic studies of crossing of the wild boar (Sus scrofa ferus) and the domestic pig (Sus scrofa dom.)].
Sysa PS, Sławomirski J, Gromadzka J. Sysa PS, et al. Pol Arch Weter. 1984;24(1):89-95. Pol Arch Weter. 1984. PMID: 6537490 Polish. - Mating of escaped domestic pigs with wild boar and possibility of their offspring migration after the Fukushima Daiichi Nuclear Power Plant accident.
Anderson D, Toma R, Negishi Y, Okuda K, Ishiniwa H, Hinton TG, Nanba K, Tamate HB, Kaneko S. Anderson D, et al. Sci Rep. 2019 Aug 8;9(1):11537. doi: 10.1038/s41598-019-47982-z. Sci Rep. 2019. PMID: 31395920 Free PMC article. - Wild boar and infectious diseases: evaluation of the current risk to human and domestic animal health in Switzerland: A review.
Meier R, Ryser-Degiorgis M. Meier R, et al. Schweiz Arch Tierheilkd. 2018 Jul;160(7-8):443-460. doi: 10.17236/sat00168. Schweiz Arch Tierheilkd. 2018. PMID: 29989552 Review. English.
Cited by
- Historic samples reveal loss of wild genotype through domestic chicken introgression during the Anthropocene.
Wu MY, Forcina G, Low GW, Sadanandan KR, Gwee CY, van Grouw H, Wu S, Edwards SV, Baldwin MW, Rheindt FE. Wu MY, et al. PLoS Genet. 2023 Jan 19;19(1):e1010551. doi: 10.1371/journal.pgen.1010551. eCollection 2023 Jan. PLoS Genet. 2023. PMID: 36656838 Free PMC article. - Spatial genetic structure of European wild boar, with inferences on late-Pleistocene and Holocene demographic history.
de Jong JF, Iacolina L, Prins HHT, van Hooft P, Crooijmans RPMA, van Wieren SE, Baños JV, Baubet E, Cahill S, Ferreira E, Fonseca C, Glazov PM, Jelenko Turinek I, Lizana Martín VM, Náhlik A, Pokorny B, Podgórski T, Šprem N, Veeroja R, Ydenberg RC, Megens HJ. de Jong JF, et al. Heredity (Edinb). 2023 Mar;130(3):135-144. doi: 10.1038/s41437-022-00587-1. Epub 2023 Jan 13. Heredity (Edinb). 2023. PMID: 36639700 Free PMC article. - Extensive genome introgression between domestic ferret and European polecat during population recovery in Great Britain.
Etherington GJ, Ciezarek A, Shaw R, Michaux J, Croose E, Haerty W, Di Palma F. Etherington GJ, et al. J Hered. 2022 Oct 21;113(5):500-515. doi: 10.1093/jhered/esac038. J Hered. 2022. PMID: 35932226 Free PMC article. - Genome-wide analysis of hybridization in wild boar populations reveals adaptive introgression from domestic pig.
Mary N, Iannuccelli N, Petit G, Bonnet N, Pinton A, Barasc H, Faure A, Calgaro A, Grosbois V, Servin B, Ducos A, Riquet J. Mary N, et al. Evol Appl. 2022 Jul 2;15(7):1115-1128. doi: 10.1111/eva.13432. eCollection 2022 Jul. Evol Appl. 2022. PMID: 35899256 Free PMC article. - Genomic consequences of a century of inbreeding and isolation in the Danish wild boar population.
Yıldız B, Megens HJ, Hvilsom C, Bosse M. Yıldız B, et al. Evol Appl. 2022 May 17;15(6):954-966. doi: 10.1111/eva.13385. eCollection 2022 Jun. Evol Appl. 2022. PMID: 35782012 Free PMC article.
References
- Manel S, Schwartz MK, Luikart G, Taberlet P. Landscape genetics: combining landscape ecology and population genetics. Trends Ecol Evol. 2003;18(4):189–197. doi: 10.1016/S0169-5347(03)00008-9. - DOI
- Hartl GB, Zachos F, Nadlinger K. Genetic diversity in European red deer (cervus elaphus L.): anthropogenic influences on natural populations. Cr Biol. 2003;326:S37–S42. - PubMed
Publication types
MeSH terms
LinkOut - more resources
Full Text Sources
Other Literature Sources
Medical


