Induction of pluripotency in mouse somatic cells with lineage specifiers - PubMed (original) (raw)
. 2013 May 23;153(5):963-75.
doi: 10.1016/j.cell.2013.05.001.
Chen Wu, Yetao Wu, Zhiyuan Li, Sida Shao, Wenhui Zhao, Xing Tang, Huan Yang, Lijun Shen, Xiaohan Zuo, Weifeng Yang, Yan Shi, Xiaochun Chi, Hongquan Zhang, Ge Gao, Youmin Shu, Kehu Yuan, Weiwu He, Chao Tang, Yang Zhao, Hongkui Deng
Affiliations
- PMID: 23706735
- PMCID: PMC4640445
- DOI: 10.1016/j.cell.2013.05.001
Induction of pluripotency in mouse somatic cells with lineage specifiers
Jian Shu et al. Cell. 2013.
Erratum in
- Cell. 2015 May 21;161(5):1229
Abstract
The reprogramming factors that induce pluripotency have been identified primarily from embryonic stem cell (ESC)-enriched, pluripotency-associated factors. Here, we report that, during mouse somatic cell reprogramming, pluripotency can be induced with lineage specifiers that are pluripotency rivals to suppress ESC identity, most of which are not enriched in ESCs. We found that OCT4 and SOX2, the core regulators of pluripotency, can be replaced by lineage specifiers that are involved in mesendodermal (ME) specification and in ectodermal (ECT) specification, respectively. OCT4 and its substitutes attenuated the elevated expression of a group of ECT genes, whereas SOX2 and its substitutes curtailed a group of ME genes during reprogramming. Surprisingly, the two counteracting lineage specifiers can synergistically induce pluripotency in the absence of both OCT4 and SOX2. Our study suggests a "seesaw model" in which a balance that is established using pluripotency factors and/or counteracting lineage specifiers can facilitate reprogramming.
Copyright © 2013 Elsevier Inc. All rights reserved.
Figures
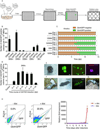
Figure 1. GATA3 Can Substitute for OCT4 to Induce Pluripotency in Mouse Somatic Cells
(A) Schematic representation of the gene screening process. For the screen, a plasmid library of 10,080 human genes was analyzed. An OCT4 plasmid and empty vectors (EV) were used as positive and negative controls in the first and second column, respectively. (B) Reprogramming assay that determines the ability of the lineage specifier GATA3 to enhance reprogramming in the absence of OCT4, SOX2, KLF4, or c-MYC. The _Oct4_-GFP-positive colonies were counted at 9 days post-infection (dpi). SKM, OKM, OSM, OSK, and SK plus EV were used as negative controls. OSKM was used as a positive control. Error bars indicate the SD (n = 3). (C) The kinetics of reprogramming using different combinations of genes. For the 50,000 MEFs seeded per well, the GFP fluorescence was monitored every 24 hours. The orange bars indicate that no _Oct4_-GFP-positive cells were observed, whereas the green bars indicate the emergence of _Oct4_-GFP-positive cells. Two representative independent experimental sets are shown. (D) The _Oct4_-GFP-positive colonies generated by dox-inducible GATA3 and constantly expressed SKM were counted at 10 dpi. Dox was added to the culture medium for various periods of time to induce the expression of GATA3. SKM plus EV was used as a negative control. Error bars indicate the SD (n = 3). (E) The generation of iPS colonies with G3SKM from _Oct4_-GFP MEFs. Phase and GFP images of a primary iPS colony, GFP images of passaged iPS colonies, and the expression of NANOG in iPS colonies are depicted from left to right. Scale bars represent 100 m. (F) An adult chimeric mouse (left) generated from G3SKM-induced iPSCs (#1). Phase (middle) and GFP (right) images of the male gonads dissected from an E13.5 G3SKM-iPS-#1 chimeric embryo. (G) Germline transmission mice (agouti) from #1 are depicted. (H) The flow cytometric analysis of GFP in G3SKM-secondary MEFs without (left panel) and with (middle panel) dox. RT-qPCR analysis of the relative expression of endogenous Oct4 in G3SKM-secondary MEFs in the process of dox induction. Representative results from three independent experiments are shown. Error bars indicate the SD (n = 3). See also Figures S1, S2 and Tables S1, S2.
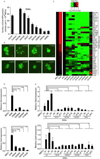
Figure 2. OCT4 and GATA3 Can Inhibit a Group of ECT Genes that are Elevated by SKM during Reprogramming
(A) RT-qPCR analysis of the expression of endogenous Cdh1, Cdh2, Snai1, p53, and p21 relative to their expression in MEFs. The samples were tested at 4 dpi. Error bars indicate the SD (n = 3). (B) Cell proliferation curves. SKM was used as a control, and 50,000 MEFs were seeded per well. Three wells were harvested every 24 hours to count the number of cells. The cell populations were analyzed using a paired two-tailed Student's _t_-test. No significant difference was observed between G3SKM- and SKM-infected MEFs (P = 0.7803). (C) A Venn diagram illustrating the overlap between the expression changes identified in cells induced with G3SKM and OSKM. The blue circle represents the DE lists (expression change > two fold, P < 0.05, FDR < 0.01) in G3SKM-induced cells compared with SKM-induced cells. The purple circle represents the DE lists of OSKM-induced cells compared with SKM-induced cells. (D) Gene Ontology (GO) analysis of the overlapping genes in (C). The GO analysis was based on the DE list. The P values represent the Bonferroni-corrected EASE score. (E) GO analysis of genes regulated by SKM, G3SKM, and OSKM at 7 dpi. The GO analysis was based on the DE list. The P values represent the Bonferroni-corrected EASE score. (F) Heatmaps depicting the relative fold change of gene expression at 7 dpi based on the ECT-related genes by RNA-seq. Red and green indicate increased and decreased expression, respectively.
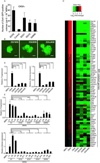
Figure 3. Identification of Other Substitutes for OCT4 that also Inhibit ECT-related Genes Elevated by SKM during Reprogramming
(A) Identification of additional lineage specifiers that are related to the ME lineage that can replace OCT4 during reprogramming. The _Oct4_-GFP-positive colonies were counted at 9 dpi. SKM plus EV was used as a control. Error bars indicate the SD (n = 3). (B) GFP images of iPS colonies generated with SKM+GATA6 (G6SKM), SKM+GATA3 (G3SKM), SKM+SOX7 (S7SKM), SKM+PAX1 (P1SKM), SKM+GATA4 (G4SKM), SKM+CEBPa (CaSKM), SKM+HNF4a (H4SKM), and SKM+GRB2 (GrSKM). Scale bars represent 100 m. (C) Heatmaps depicting the relative fold change of gene expression at 7 dpi based on the ECT-related genes by microarray. Red and green indicate increased and decreased expression, respectively. (D) RT-qPCR analysis of the expression of endogenous Dlx3 (upper panel) and Lhx5 (lower panel) relative to the expression in SKM. The samples were tested at 7 dpi after removal of _Oct4_-GFP-positive cells. Significance was assessed compared with the controls using a one-tailed Student’s _t_-test. ***, P < 0.001. Error bars indicate the SD (n = 3). (E) RT-qPCR analysis of the expression of endogenous Dlx3 (upper panel) and Lhx5 (lower panel) relative to the expression in SKM from a single colony; three colonies from each condition were tested. Significance was assessed compared with the controls using a one-tailed Student's _t_-test. * P < 0.05. Error bars indicate the SD (n = 3). See also Figures S3, S4 and Tables S2, S3, S4.
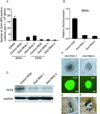
Figure 4. Inhibition of the Master ECT Gene Dlx3 Facilitates Reprogramming in the Presence of SKM
(A) shRNAs targeting Dlx3 were introduced into MEFs with SKM or OKM. Scrambled shRNA (control RNAi) was used as a control. The _Oct4_-GFP-positive colonies were counted at 9 dpi. Error bars indicate the SD (n = 3). (B) RT-qPCR analysis of the expression of endogenous Dlx3 relative to the expression in control. SKM plus scramble shRNA (control RNAi) was used as a control. The samples were tested at 7 dpi. Error bars indicate the SD (n = 3). (C) Western blot analysis of DLX3 in control and knockdown cells in the presence of a SKM virus cocktail. GAPDH was used as a loading control. (D) Phase and GFP images of iPS colonies generated with Dlx3 RNAi 1 and Dlx3 RNAi 2 in the presence of SKM. Scale bars represent 100 µm. (E) Adult chimeric mice generated from Dlx3 RNAi 2-induced iPSCs (#1). (F) A germline transmission mouse (agouti) from #1 is depicted. See also Figure S5.
Figure 5. SOX2 and Its Substitutes Attenuate the Expression of ME Genes that are Elevated by OKM during Reprogramming
(A) Identification of lineage specifiers related to the ECT lineage that can facilitate reprogramming in the presence of OKM. The _Oct4_-GFP-positive colonies were counted at 9 dpi. OKM plus EV was used as a control. Error bars indicate the SD (n = 3). (B) GFP images of iPS colonies generated with OKM+SOX1 (OS1KM), OKM+SOX3 (OS3KM), and OKM+GMNN (OGmKM). Scale bars represent 100 m. (C) Heatmaps depicting the relative fold change of gene expression at 7 dpi based on the ME-related genes by microarray. Red and green indicate increased and decreased expression, respectively. (D) RT-qPCR analysis of the expression of endogenous T (left panel) and Eomes (right panel) relative to the expression in OKM. Significance was assessed compared with the controls using a one-tailed Student's _t_-test. *** P < 0.001. The samples were tested at 7 dpi. Error bars indicate the SD (n = 3). (E) The expression of endogenous T (upper panel) and Eomes (lower panel) relative to the expression in OKM from a single colony; three colonies from each condition were tested. Significance was assessed compared with the controls using a one-tailed Student's _t_-test. * P < 0.05, *** P < 0.001. Error bars indicate the SD (n = 3). See also Figure S4 and Tables S2, S4.
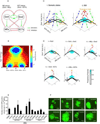
Figure 6. Balanced Equilibrium Facilitates the Induction of Pluripotency
(A) A model for the coupled pluripotency module (self-activation of Oct4 and Sox2) and for the differentiation module (mutual antagonism between the ME and ECT lineages). (B) The cell-state landscape obtained from the density of the trajectories. The blue color indicates deep “attractors” near which the cell states tend to stay. The x_-axis represents the difference between the two groups of lineage inducers, and the y_-axis indicates the "pluripotency" of the cell. (C and D) The phase space without (box i)/with KM (box ii) under no input, respectively (C). Different reprogramming strategies with KM and the trajectory starting from the ME state are shown (D). The blue circuit indicates the ME state where the trajectories start. Yellow dots indicate stable cell states. The changing directions of cell states are marked by arrows. The trajectories that end up in the ME state, the ECT state, and the pluripotent state are colored by blue, green, and red, respectively. Cyan indicates the region where the reprogramming is possible. Dark lines are the nullclines of the differentiation module when the pluripotency-module is OFF. When the stable crossing point falls into the cyan reprogramming region, pluripotency can be restored. (E) The generation of mouse iPSCs in the absence of both OCT4 and SOX2. KM plus EV was used as a control. The Oct4_-GFP-positive colonies were counted at 9 dpi. Error bars indicate the SD (n = 3). (F) GFP images of iPS colonies generated with KM+GATA3+SOX1 (G3S1KM), KM+GATA3+SOX3 (G3S3KM), KM+GATA6+SOX1 (G6S1KM), KM+GATA6+SOX3 (G6S3KM), KM+GATA6+ GMNN (G6GmKM), KM+PAX1+SOX1 (P1S1KM), KM+PAX1+SOX3_ (P1S3KM), and OSKM. Scale bars represent 100 m. See also Figures S6, S7 and Table S5, S6.
Figure 7. The “seesaw model”
A diagram of the “seesaw model.” Blue clouds indicate the regions that the cell states are likely to sample with noise. The pluripotency state (red ball) is located near the balanced region. When the seesaw is balanced between the two differentiation potentials, the cell has a higher probability of entering the pluripotent state.
Comment in
- New balance in pluripotency: reprogramming with lineage specifiers.
Ben-David U, Nissenbaum J, Benvenisty N. Ben-David U, et al. Cell. 2013 May 23;153(5):939-40. doi: 10.1016/j.cell.2013.04.051. Cell. 2013. PMID: 23706730 - And then there were none: no need for pluripotency factors to induce reprogramming.
Chou BK, Cheng L. Chou BK, et al. Cell Stem Cell. 2013 Sep 5;13(3):261-2. doi: 10.1016/j.stem.2013.08.004. Cell Stem Cell. 2013. PMID: 24012365 Free PMC article.
Similar articles
- Reprogramming of human fibroblasts to pluripotency with lineage specifiers.
Montserrat N, Nivet E, Sancho-Martinez I, Hishida T, Kumar S, Miquel L, Cortina C, Hishida Y, Xia Y, Esteban CR, Izpisua Belmonte JC. Montserrat N, et al. Cell Stem Cell. 2013 Sep 5;13(3):341-50. doi: 10.1016/j.stem.2013.06.019. Epub 2013 Jul 18. Cell Stem Cell. 2013. PMID: 23871606 - Lineage specifiers: new players in the induction of pluripotency.
Shu J, Deng H. Shu J, et al. Genomics Proteomics Bioinformatics. 2013 Oct;11(5):259-63. doi: 10.1016/j.gpb.2013.09.005. Epub 2013 Oct 4. Genomics Proteomics Bioinformatics. 2013. PMID: 24095709 Free PMC article. Review. - GATA family members as inducers for cellular reprogramming to pluripotency.
Shu J, Zhang K, Zhang M, Yao A, Shao S, Du F, Yang C, Chen W, Wu C, Yang W, Sun Y, Deng H. Shu J, et al. Cell Res. 2015 Feb;25(2):169-80. doi: 10.1038/cr.2015.6. Epub 2015 Jan 16. Cell Res. 2015. PMID: 25591928 Free PMC article. - Disruption of OCT4 Ubiquitination Increases OCT4 Protein Stability and ASH2L-B-Mediated H3K4 Methylation Promoting Pluripotency Acquisition.
Li S, Xiao F, Zhang J, Sun X, Wang H, Zeng Y, Hu J, Tang F, Gu J, Zhao Y, Jin Y, Liao B. Li S, et al. Stem Cell Reports. 2018 Oct 9;11(4):973-987. doi: 10.1016/j.stemcr.2018.09.001. Epub 2018 Sep 27. Stem Cell Reports. 2018. PMID: 30269953 Free PMC article. - Understanding the roadmaps to induced pluripotency.
Liu K, Song Y, Yu H, Zhao T. Liu K, et al. Cell Death Dis. 2014 May 15;5(5):e1232. doi: 10.1038/cddis.2014.205. Cell Death Dis. 2014. PMID: 24832604 Free PMC article. Review.
Cited by
- Human Ocular Epithelial Cells Endogenously Expressing SOX2 and OCT4 Yield High Efficiency of Pluripotency Reprogramming.
Poon MW, He J, Fang X, Zhang Z, Wang W, Wang J, Qiu F, Tse HF, Li W, Liu Z, Lian Q. Poon MW, et al. PLoS One. 2015 Jul 1;10(7):e0131288. doi: 10.1371/journal.pone.0131288. eCollection 2015. PLoS One. 2015. PMID: 26131692 Free PMC article. - Pluripotent and Metabolic Features of Two Types of Porcine iPSCs Derived from Defined Mouse and Human ES Cell Culture Conditions.
Zhang W, Pei Y, Zhong L, Wen B, Cao S, Han J. Zhang W, et al. PLoS One. 2015 Apr 20;10(4):e0124562. doi: 10.1371/journal.pone.0124562. eCollection 2015. PLoS One. 2015. PMID: 25893435 Free PMC article. - Pluripotency gene network dynamics: System views from parametric analysis.
Akberdin IR, Omelyanchuk NA, Fadeev SI, Leskova NE, Oschepkova EA, Kazantsev FV, Matushkin YG, Afonnikov DA, Kolchanov NA. Akberdin IR, et al. PLoS One. 2018 Mar 29;13(3):e0194464. doi: 10.1371/journal.pone.0194464. eCollection 2018. PLoS One. 2018. PMID: 29596533 Free PMC article. - Stem cells: A designer's guide to pluripotency.
Wu J, Izpisua Belmonte JC. Wu J, et al. Nature. 2014 Dec 11;516(7530):172-3. doi: 10.1038/516172a. Nature. 2014. PMID: 25503227 No abstract available. - Reprogramming cell fate with a genome-scale library of artificial transcription factors.
Eguchi A, Wleklinski MJ, Spurgat MC, Heiderscheit EA, Kropornicka AS, Vu CK, Bhimsaria D, Swanson SA, Stewart R, Ramanathan P, Kamp TJ, Slukvin I, Thomson JA, Dutton JR, Ansari AZ. Eguchi A, et al. Proc Natl Acad Sci U S A. 2016 Dec 20;113(51):E8257-E8266. doi: 10.1073/pnas.1611142114. Epub 2016 Dec 5. Proc Natl Acad Sci U S A. 2016. PMID: 27930301 Free PMC article.
References
- Aoi T, Yae K, Nakagawa M, Ichisaka T, Okita K, Takahashi K, Chiba T, Yamanaka S. Generation of Pluripotent Stem Cells from Adult Mouse Liver and Stomach Cells. Science. 2008;321:699–702. - PubMed
- Cao Q, Zhang X, Lu L, Yang L, Gao J, Gao Y, Ma H, Cao Y. Klf4 is required for germ-layer differentiation and body axis patterning during Xenopus embryogenesis. Development. 2012;139:3950–3961. - PubMed
- Chazaud C, Yamanaka Y, Pawson T, Rossant J. Early Lineage Segregation between Epiblast and Primitive Endoderm in Mouse Blastocysts through the Grb2-MAPK Pathway. Developmental Cell. 2006;10:615–624. - PubMed
Publication types
MeSH terms
Substances
LinkOut - more resources
Full Text Sources
Other Literature Sources
Molecular Biology Databases
