GATA-3 controls the maintenance and proliferation of T cells downstream of TCR and cytokine signaling - PubMed (original) (raw)
GATA-3 controls the maintenance and proliferation of T cells downstream of TCR and cytokine signaling
Yunqi Wang et al. Nat Immunol. 2013 Jul.
Abstract
GATA-3 controls T helper type 2 (TH2) differentiation. However, whether GATA-3 regulates the function of mature T cells beyond TH2 determination remains poorly understood. We found that signaling via the T cell antigen receptor (TCR) and cytokine stimulation promoted GATA-3 expression in CD8(+) T cells, which controlled cell proliferation. Although GATA-3-deficient CD8(+) T cells were generated, their peripheral maintenance was impaired, with lower expression of the receptor for interleukin 7 (IL-7R). GATA-3-deficient T cells had defective responses to viral infection and alloantigen. The proto-oncoprotein c-Myc was a critical target of GATA-3 in promoting T cell proliferation. Our study thus demonstrates an essential role for GATA-3 in controlling the maintenance and proliferation of T cells and provides insight into immunoregulation.
Conflict of interest statement
Competing financial interests
The authors declare no competing financial interests.
Figures
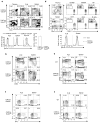
Fig. 1. TCR and cytokine stimulation promoted GATA-3 expression in CD8 T cells
(a) GATA-3 expression in CD4 T cells (dashed line), CD8 T cells (solid line) and B cells (dotted line) purified from wild-type mice and CD8 T cells purified from Cd4Cre-_Gata3_fl/fl mice (KO, shaded) as assessed by intra-cellular staining and immuno-blotting. Results shown are representative of at least three experiments. (b) GATA-3 expression in naïve CD8 T cells and CD8 T cells stimulated with anti-CD3 for 72 hours as assessed by intracellular staining and immuno-blotting. Representative results of at least three experiments are shown. (c) GATA-3 expression in CD8 T cells stimulated with anti-CD3 for 72 hours, in the absence (Mock) or presence of IL-2 or IL-4 as assessed by intracellular staining and immuno-blotting. Results shown are representative of at least three experiments. (d) Flow cytometry of IL-4 production in CD8 and CD4 T cells isolated from wild-type mice and activated with anti-CD3 and anti-CD28, in the absence (Mock) or presence of IL-2 or IL-4 for 72 hours. Representative results of at least three experiments are shown. (e) Numbers of live CD8 T cells recovered after 72 hours of culture as in d. Means ± SD were shown. (* P<0.05). (f) CFSE dilution in CD8 T cells labeled with CFSE assessed 72 hours after stimulation with anti-CD3, in the absence (Mock) or presence of IL-2 or IL-4. Results shown are representative of at least three experiments.
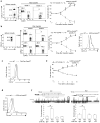
Fig. 2. CD8 T cell development in the absence of GATA-3
(a) Flow cytometry of T cell distribution in the thymus, peripheral lymph-nodes (PLN) and spleens of Cd4Cre-_Gata3_fl/fl and Cd4Cre-_Gata3_fl/+ mice (top panels). GATA-3 expression assessed by intracellular staining and qRT-PCR (lower panels). Flow-cytometric results are representative of at least three experiments. qRT-PCR results are means ± SD of triplicates done in one experiment representative of at least three. (b) Flow cytometry of CD44 and CD62L expression in CD8 T cells isolated from PLN and spleen of Cd4Cre-_Gata3_fl/fl and Cd4Cre-_Gata3_fl/+ mice. Representative results of at least three experiments are shown. (c) Flow cytometry of IFN-γ and IL-4 production in CD8 T cells isolated from PLN and spleen of Cd4Cre-_Gata3_fl/fl and Cd4Cre-_Gata3_fl/+ mice. Results are representative of at least three experiments. (d) Flow cytometry of T cell populations in the mixed bone marrow chimera containing wild-type (CD45.1) and Cd4Cre-_Gata3_fl/fl (CD45.2) T cells (top panels). Means ± SD of five mice from one experiment representative of two are shown. GATA-3 expression assessed by intracellular staining (lower panels). (e) Flow cytometry of CD44 and CD62L expression in CD8 T cells from the mixed bone marrow chimera described in d. Results are representative of at least three experiments. (f) Flow cytometry of IFN-γ and IL-4 production in CD8 T cells from the mixed bone marrow chimera described in d. Results are representative of at least three experiments.
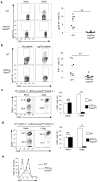
Fig. 3. Defective peripheral maintenance of GATA-3-deficient CD8 T cells
(a) Flow cytometry of CD8 T cell distribution during peripheral maintenance experiments using wild-type (CD45.1) and Cd4Cre-_Gata3_fl/fl (CD45.2) donor cells. Representative results and means ± SD of five mice from one experiment of two are shown (* P<0.05). (b) Flow cytometry of CD8 T cell distribution during peripheral maintenance experiments using wild-type (CD45.1) and ERCre-_Gata3_fl/fl (CD45.2) donor cells. Representative results and means ± SD of five mice from one experiment of two are shown (* P<0.05). GATA-3 expression was also assessed by flow-cytometry one week after tamoxifen (TMA) treatment. (c) Flow cytometry of CD127 expression in CD8 T cells of wild-type (solid line) and Cd4Cre-_Gata3_fl/fl (dashed line) origins in the recipient mice described in a. (d) Flow-cytometry of CD127 expression in CD8 T cells of wild-type (solid line) and ERCre-_Gata3_fl/fl (dashed line) origins in recipient mice described in b. (e) Flow cytometry of CD8 T cell distribution during IL-7 response experiment. Means ± SD of triplicate in one experiment representative of two are shown (* P<0.05). (f) GATA-3 binding to a conversed non-coding sequence in Il7r locus and to the CGRE site within the TH2 locus in CD8 T cells isolated from wild-type and Cd4Cre-_Gata3_fl/fl (KO) mice detected by chromatin-immunoprecipitation (ChIP). Means ± SD of triplicates done in one experiment representative of at least three are shown. (* P<0.05)
Fig. 4. Activated CD8 T cell function requires GATA-3
(a) Flow cytometry of CD25, CD44 and CD69 expression on wild-type (CD45.1) and Cd4Cre-_Gata3_fl/fl (CD45.2) CD8 T cells that were co-cultured and activated for 24 hours. Results are representative of at least three experiments. (b) The proliferation of wild-type (CD45.1) and Cd4Cre-_Gata3_fl/fl (CD45.2) CD8 T cells that were co-cultured and activated for 72 hours in the absence (Mock) or presence of indicated cytokines as assessed by CFSE dilution and flow cytometry. Results representative of at least three experiments are shown. (c) Flow cytometry of IFN-γ production by CD8 T cells described in b. Means ± SD of three experiments are shown. (d) Flow cytometry of CD25, CD44 and CD69 expression on wild-type (CD45.1) and ERCre-_Gata3_fl/fl (CD45.2) CD8 T cells that were co-cultured and activated for 24 hours in the presence of 4-HT. Results are representative of at least three experiments. (e) The proliferation of wild-type (CD45.1) and ERCre-_Gata3_fl/fl (CD45.2) CD8 T cells that were co-cultured and activated in the absence (Mock) or presence of indicated cytokines for 72 hours while 4-HT was added, as assessed by CFSE dilution and flow-cytometry. Results are representative of at least three experiments. (f) Flow cytometry of IFN-γ production by CD8 T cells described in e. Means ± SD of three experiments are shown.
Fig. 5. GATA-3 is important for activated CD8 T cell expansion in vivo
(a) Flow cytometry of gp33-tetramer+ wild-type (CD45.1) and Cd4Cre-_Gata3_fl/fl (CD45.2) CD8 T cells in the recipients (CD45.1xCD45.2) after LCMV infection. Representative flow-cytometric plots and combined results from multiple mice from two experiments are shown (** P<0.01). (b) Flow cytometry of IFN-γ production by wild-type (CD45.1) and Cd4Cre-_Gata3_fl/fl (CD45.2) CD8 T cells (described in a) upon gp33-41 peptide re-stimulation. Representative flow-cytometric plots and combined results from multiple mice from two experiments are shown (** P<0.01). (c) Flow cytometry of CD8 T cell distribution in _Rag2_−/−_γc_−/− recipient mice (Balb/c) where GvH response was induced by transferred splenocytes from both wild-type (CD45.1, C57BL/6) and ERCre-_Gata3_fl/fl (CD45.2, C57BL/6) mice. Tamoxifen (TMA) or vehicle (Mock) was injected at the time of cell transfer. Representative flow-cytometric plots and means ± SD of five mice from one experiment representative of two are also shown. (NS, non-significant; * P<0.05). (d) Flow cytometry of CD8 T cell distribution in _Rag2_−/−_γc_−/− recipient mice (Balb/c) where GvH response was induced by transferred splenocytes from both wild-type (CD45.1, C57BL/6) and ERCre-_Gata3_fl/fl (CD45.2, C57BL/6) mice. Tamoxifen (TMA) or vehicle (Mock) was injected two weeks after cell transfer. Representative flow-cytometric plots and means ± SD of five mice from one experiment representative of two are shown (NS, non-significant; * P<0.05). (e) Flow cytometry of Ki67 expression in wild-type and ERCre-_Gata3_fl/fl CD8 T cells during GvH response as described in c. Result is representative of at least three experiments.
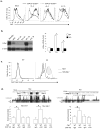
Fig. 6. GATA-3 controls c-Myc expression
(a) Flow cytometry of the cell size of Cd4Cre-_Gata3_fl/fl and Cd4Cre-Gata3fl/+ CD8 T cells that were sorted naïve (CD62LhiCD44lo) and stimulated with anti-CD3 and anti-CD28 in the absence (Mock) or presence of indicated cytokines for 24 hours. Results are representative of at least three experiments. (b) The protein and mRNA expression of c-Myc in wild-type and Cd4Cre-_Gata3_fl/fl (KO) CD8 T cells that were sorted naïve (CD62LhiCD44lo) and stimulated with anti-CD3 and anti-CD28 as assessed by immuno-blotting and qRT-PCR respectively. Immuno-blotting results are representative of at least three experiments. qRT-PCR results are means ± SD of triplicates done in one experiment representative of three (*P<0.05). Immune-blotting for c-Myc in wild-type CD8 T cells transduced either with MSCV-IRES-EGFP (MIG) control virus or with MSCV-Myc-IRES-EGFP (MIG-Myc) viruses. Results are representative of at least two experiments. (c) Comparison of the proliferation of MIG and MIG-Myc -transduced (GFP+) wild-type and ERCre-_Gata3_fl/fl (KO) CD8 T cells that were stimulated with anti-CD3 and anti-CD28 in the presence of IL-2 and 4-HT for 4 days, as assessed by Cell Trace Violet dye dilution with flow cytometry. Representative results of at least three experiments are shown. (d) GATA-3 binding to conversed non-coding sequences in Myc locus and the CGRE site within the Th2 locus in CD8 T cells isolated from wild-type and Cd4Cre-_Gata3_fl/fl (KO) mice detected by ChIP. Means ± SD of triplicates done in one experiment representative of at least three are shown. (* P<0.05)
Similar articles
- Effective T-cell immune responses in the absence of the serine/threonine kinase RIP2.
Nembrini C, Reissmann R, Kopf M, Marsland BJ. Nembrini C, et al. Microbes Infect. 2008 Apr;10(5):522-30. doi: 10.1016/j.micinf.2008.01.016. Epub 2008 Feb 8. Microbes Infect. 2008. PMID: 18403232 - Interferons direct Th2 cell reprogramming to generate a stable GATA-3(+)T-bet(+) cell subset with combined Th2 and Th1 cell functions.
Hegazy AN, Peine M, Helmstetter C, Panse I, Fröhlich A, Bergthaler A, Flatz L, Pinschewer DD, Radbruch A, Löhning M. Hegazy AN, et al. Immunity. 2010 Jan 29;32(1):116-28. doi: 10.1016/j.immuni.2009.12.004. Epub 2010 Jan 14. Immunity. 2010. PMID: 20079668 - IL-7Rαlow CD8+ T Cells from Healthy Individuals Are Anergic with Defective Glycolysis.
Sim JH, Kim JH, Park AK, Lee J, Kim KM, Shin HM, Kim M, Choi K, Choi EY, Kang I, Lee DS, Kim HR. Sim JH, et al. J Immunol. 2020 Dec 1;205(11):2968-2978. doi: 10.4049/jimmunol.1901470. Epub 2020 Oct 26. J Immunol. 2020. PMID: 33106337 - Differential role of IL-2R signaling for CD8+ T cell responses in acute and chronic viral infections.
Bachmann MF, Wolint P, Walton S, Schwarz K, Oxenius A. Bachmann MF, et al. Eur J Immunol. 2007 Jun;37(6):1502-12. doi: 10.1002/eji.200637023. Eur J Immunol. 2007. PMID: 17492805 - GATA-3 function in innate and adaptive immunity.
Tindemans I, Serafini N, Di Santo JP, Hendriks RW. Tindemans I, et al. Immunity. 2014 Aug 21;41(2):191-206. doi: 10.1016/j.immuni.2014.06.006. Immunity. 2014. PMID: 25148023 Review.
Cited by
- Genomic and transcriptomic analyses identify distinctive features of triple-negative inflammatory breast cancer.
Wang X, Zhao L, Song X, Wu X, Krishnamurthy S, Semba T, Shao S, Knafl M, Coffer LW 2nd, Alexander A, Vines A, Bopparaju S, Woodward WA, Chu R, Zhang J, Yam C, Loo LWM, Nasrazadani A, Huong LP, Woodman SE, Futreal A; Rare Tumor Initiative Team; Tripathy D, Ueno NT. Wang X, et al. NPJ Precis Oncol. 2024 Nov 18;8(1):265. doi: 10.1038/s41698-024-00729-0. NPJ Precis Oncol. 2024. PMID: 39558017 Free PMC article. - Mapping cellular interactions from spatially resolved transcriptomics data.
Zhu J, Wang Y, Chang WY, Malewska A, Napolitano F, Gahan JC, Unni N, Zhao M, Yuan R, Wu F, Yue L, Guo L, Zhao Z, Chen DZ, Hannan R, Zhang S, Xiao G, Mu P, Hanker AB, Strand D, Arteaga CL, Desai N, Wang X, Xie Y, Wang T. Zhu J, et al. Nat Methods. 2024 Oct;21(10):1830-1842. doi: 10.1038/s41592-024-02408-1. Epub 2024 Sep 3. Nat Methods. 2024. PMID: 39227721 - Integrated transcriptomic analysis reveals immune signatures distinguishing persistent versus resolving outcomes in MRSA bacteremia.
Parmar R, Pickering H, Ahn R, Rossetti M, Gjertson DW, Ruffin F, Chan LC, Fowler VG Jr, Yeaman MR, Reed EF; MRSA Systems Immunology Group. Parmar R, et al. Front Immunol. 2024 May 23;15:1373553. doi: 10.3389/fimmu.2024.1373553. eCollection 2024. Front Immunol. 2024. PMID: 38846955 Free PMC article. - Deciphering the developmental trajectory of tissue-resident Foxp3+ regulatory T cells.
Alvarez F, Liu Z, Bay A, Piccirillo CA. Alvarez F, et al. Front Immunol. 2024 Mar 28;15:1331846. doi: 10.3389/fimmu.2024.1331846. eCollection 2024. Front Immunol. 2024. PMID: 38605970 Free PMC article. Review. - Expansion of memory Vδ2 T cells following SARS-CoV-2 vaccination revealed by temporal single-cell transcriptomics.
Terzoli S, Marzano P, Cazzetta V, Piazza R, Sandrock I, Ravens S, Tan L, Prinz I, Balin S, Calvi M, Carletti A, Cancellara A, Coianiz N, Franzese S, Frigo A, Voza A, Calcaterra F, Di Vito C, Della Bella S, Mikulak J, Mavilio D. Terzoli S, et al. NPJ Vaccines. 2024 Mar 20;9(1):63. doi: 10.1038/s41541-024-00853-9. NPJ Vaccines. 2024. PMID: 38509155 Free PMC article.
References
- Cantrell D. T cell antigen receptor signal transduction pathways. Annu Rev Immunol. 1996;14:259–274. - PubMed
- Miyajima A, Kitamura T, Harada N, Yokota T, Arai K. Cytokine receptors and signal transduction. Annu Rev Immunol. 1992;10:295–331. - PubMed
- Zheng W, Flavell RA. The transcription factor GATA-3 is necessary and sufficient for Th2 cytokine gene expression in CD4 T cells. Cell. 1997;89:587–596. - PubMed
- Zhu J, et al. Conditional deletion of Gata3 shows its essential function in T(H)1-T(H)2 responses. Nat Immunol. 2004;5:1157–1165. - PubMed
Publication types
MeSH terms
Substances
Grants and funding
- P30 CA016086/CA/NCI NIH HHS/United States
- R01 AI095097/AI/NIAID NIH HHS/United States
- R01 AI097392/AI/NIAID NIH HHS/United States
- R01AI097392/AI/NIAID NIH HHS/United States
LinkOut - more resources
Full Text Sources
Other Literature Sources
Molecular Biology Databases
Research Materials


