Reward prediction-related increases and decreases in tonic neuronal activity of the pedunculopontine tegmental nucleus - PubMed (original) (raw)
Reward prediction-related increases and decreases in tonic neuronal activity of the pedunculopontine tegmental nucleus
Ken-Ichi Okada et al. Front Integr Neurosci. 2013.
Abstract
The neuromodulators serotonin, acetylcholine, and dopamine have been proposed to play important roles in the execution of movement, control of several forms of attentional behavior, and reinforcement learning. While the response pattern of midbrain dopaminergic neurons and its specific role in reinforcement learning have been revealed, the roles of the other neuromodulators remain elusive. Reportedly, neurons in the dorsal raphe nucleus, one major source of serotonin, continually track the state of expectation of future rewards by showing a correlated response to the start of a behavioral task, reward cue presentation, and reward delivery. Here, we show that neurons in the pedunculopontine tegmental nucleus (PPTN), one major source of acetylcholine, showed similar encoding of the expectation of future rewards by a systematic increase or decrease in tonic activity. We recorded and analyzed PPTN neuronal activity in monkeys during a reward conditioned visually guided saccade task. The firing patterns of many PPTN neurons were tonically increased or decreased throughout the task period. The tonic activity pattern of neurons was correlated with their encoding of the predicted reward value; neurons exhibiting an increase or decrease in tonic activity showed higher or lower activity in the large reward-predicted trials, respectively. Tonic activity and reward-related modulation ended around the time of reward delivery. Additionally, some tonic changes in activity started prior to the appearance of the initial stimulus, and were related to the anticipatory fixational behavior. A partially overlapping population of neurons showed both the initial anticipatory response and subsequent predicted reward value-dependent activity modulation by their systematic increase or decrease of tonic activity. These bi-directional reward- and anticipatory behavior-related modulation patterns are suitable for the presumed role of the PPTN in reward processing and motivational control.
Keywords: acetylcholine; cholinergic; motivation; pedunculopontine tegmental nucleus; reinforcement learning; reward prediction; tonic activity.
Figures
FIGURE 1
Schematic diagram for the reward-biased visually guided saccade task. The monkeys initially fixated on the central visual stimulus, then made a saccade to the peripheral target, and finally received a juice reward. During the fixation period before the visually guided saccade and reward delivery, the shape of the FT cued the animal to expect either a large or small reward for successful completion of the trial. In the recordings from animal Ds, an uninformative small FP was shown before FT presentation. FP, fixation point; FT, fixation target; ST, saccade target.
FIGURE 2
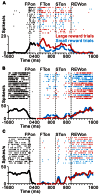
Reward-related activity modulation of the tonic excitatory and suppressive neurons. The rastergrams and spike density functions are shown in four sections. From left to right, the data are aligned to the time of FP onset, FT onset, ST onset, and reward delivery, respectively. The colored rasters and traces indicate the large reward trials (red), small reward trials (cyan), and all trials (black). (A) This representative neuron exhibited an increase in tonic activity during the task period, and showed greater activity for the large reward-predicted cue than for the small reward-predicted cue. (B) The activity of this representative neuron decreased during the task period, and showed smaller activity for the large reward-predicted cue. (C) This representative neuron also showed a decrease in tonic activity during the task period, but showed no reward prediction-related activity modulation.
FIGURE 3
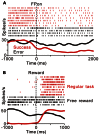
(A) Response of a representative tonic suppressive neuron in successful (red) and erroneous (black) trials. In the successful trials, this neuron showed a decrease in tonic activity around the time of FP appearance; however, there was no decrease in activity in the erroneous trials. (B) The rastergrams and spike density functions for a representative tonic suppressive neuron aligned to the delivery of free (black) and task (red) rewards. This neuron exhibited a rebound of activity shortly after reward delivery in the task condition, but remained totally unresponsive to an unexpectedly delivered reward.
FIGURE 4
Activity of the tonic excitatory and suppressive neurons of the PPTN for the saccade task. (A–C) The activity of each PPTN neuron is presented as a row of pixels for the task with (A, N = 507) and without (C, N = 185) FP presentation. From left to right, the data are aligned to the time of FP/FT onset, FT onset, ST onset, and reward delivery, respectively. The data were plotted separately for neurons that showed an increase in tonic activity (top), no significant modulation (middle), and a decrease in tonic activity (bottom). The neurons have been sorted in the order of their initiation of changes in tonic firing. The color of each pixel indicates the ROC value based on the comparison of the firing rate between a pre-fixation period just before the appearance of the initial stimulus (600 ms duration) and a test window centered on the pixel (200 ms duration). The warm colors (ROC value >0.5) indicate increases in the firing rate relative to the pre-fixation period, whereas the cool colors (ROC value <0.5) indicate decreases in the firing rate. (B–D) Population average activity is shown for the task with (B) and without (D) FP presentation, separately for tonic excitatory neurons (red) and tonic suppressive neurons (blue). (E,F) Histograms for the firing rate during the pre- (E) and post-fixation (F) periods for the tonic excitatory (red) and suppressive (blue) neurons.
FIGURE 5
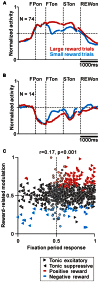
Correlation between task-related tonic activity and reward-related modulation. (A,B) Population average activity is shown separately for tonic excitatory neurons with positive reward modulation (A) and tonic suppressive neurons with negative reward modulation (B). Neurons recorded with and without FP presentation are included. (C) Plot of the fixation period response (_x_-axis) versus reward-related modulation (_y_-axis). The fixation period response was measured as the ROC value for each neuron to discriminate between its firing rates during the post-fixation period (0–600 ms after the appearance of the initial stimulus) versus the pre-fixation period (0–600 ms before the appearance of the initial stimulus). Reward-related modulation was measured between its firing rates at 0–600 ms after the appearance of the reward-conditioned FT for large versus small reward trials. The marker shapes indicate neurons with a significant increase (rightward triangles) and decrease (leftward triangles) in activity during the post-fixation period (p < 0.05). The marker colors indicate neurons that showed significantly higher (red) and lower (cyan) activity during the large reward trials (p < 0.05).
FIGURE 6
Anticipatory behavior-related activity modulation of the tonic excitatory and suppressive neurons. Examples of neuronal activity during the same set of trials are shown. The rastergrams and spike density functions are aligned to the monkeys’ gaze shift to the center of the screen (A–C) and initial target appearance (B–D). The trials are sorted by RTit. The filled and open circles indicate initial target appearance and gaze shift, respectively. The colored rasters and traces indicate the short RTit trials (purple), long RTit trials (green), large reward trials (red), and small reward trials (cyan). (A,B) This representative neuron exhibited an increase in tonic activity during the task period, and the increase in activity started before the appearance of the FP in a behavior-dependent manner. (C,D) The activity of this representative neuron was decreased in a time-locked manner to the monkey’s centering gaze shift.
FIGURE 7
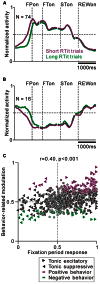
Correlation between task-related tonic activity and behavior-related modulation. (A,B) Population average activity is shown separately for the tonic excitatory neurons with positive behavioral modulation (A) and tonic suppressive neurons with negative behavioral modulation (B). (C) Plot of the post-fixation period response (_x_-axis) versus behavior-related modulation (_y_-axis). The post-fixation period response was measured as the ROC value for each neuron to discriminate between its firing rates at 0–600 ms after the appearance of the initial stimulus versus the pre-fixation period at 0–600 ms before the appearance of the initial stimulus. Behavior-related modulation was measured between its firing rates at 0–600 ms before the appearance of the initial target for short versus long RTit trials. The marker shapes indicate neurons with a significant increase (rightward triangles) and decrease (leftward triangles) in activity during the post-fixation period (p < 0.05). The marker colors indicate neurons showing significantly higher (purple) and lower (green) activity during the short RTit trials (p < 0.05).
FIGURE 8
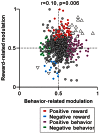
Correlation between reward- and behavior-related modulation. A plot of behavior-related modulation (_x_-axis) versus reward-related modulation (_y_-axis) is shown. Behavior-related modulation was measured between its firing rates at 0–600 ms before the appearance of the initial stimulus for short versus long RTit trials. Reward-related modulation was measured between its firing rates at 0–600 ms after the onset of the reward-conditioned FT for large versus small reward trials. The marker colors indicate neurons showing positive reward modulation (red), negative reward modulation (cyan), positive behavioral modulation (purple), and negative behavioral modulation (green) (p < 0.05). The white triangles indicate neurons showing correlated reward- and behavior-modulation by an increase (upward triangles) and decrease (downward triangles) in activity (p < 0.05).
Similar articles
- A neural correlate of predicted and actual reward-value information in monkey pedunculopontine tegmental and dorsal raphe nucleus during saccade tasks.
Okada K, Nakamura K, Kobayashi Y. Okada K, et al. Neural Plast. 2011;2011:579840. doi: 10.1155/2011/579840. Epub 2011 Oct 12. Neural Plast. 2011. PMID: 22013541 Free PMC article. Review. - Fixational saccade-related activity of pedunculopontine tegmental nucleus neurons in behaving monkeys.
Okada K, Kobayashi Y. Okada K, et al. Eur J Neurosci. 2014 Aug;40(4):2641-51. doi: 10.1111/ejn.12632. Epub 2014 May 27. Eur J Neurosci. 2014. PMID: 24863483 - Reward and Behavioral Factors Contributing to the Tonic Activity of Monkey Pedunculopontine Tegmental Nucleus Neurons during Saccade Tasks.
Okada KI, Kobayashi Y. Okada KI, et al. Front Syst Neurosci. 2016 Nov 11;10:94. doi: 10.3389/fnsys.2016.00094. eCollection 2016. Front Syst Neurosci. 2016. PMID: 27891082 Free PMC article. - Contribution of pedunculopontine tegmental nucleus neurons to performance of visually guided saccade tasks in monkeys.
Kobayashi Y, Inoue Y, Yamamoto M, Isa T, Aizawa H. Kobayashi Y, et al. J Neurophysiol. 2002 Aug;88(2):715-31. doi: 10.1152/jn.2002.88.2.715. J Neurophysiol. 2002. PMID: 12163524 - [Reward processing of the basal ganglia--reward function of pedunculopontine tegmental nucleus].
Kobayashi- Y, Okada K. Kobayashi- Y, et al. Brain Nerve. 2009 Apr;61(4):397-404. Brain Nerve. 2009. PMID: 19378809 Review. Japanese.
Cited by
- The integrative role of the pedunculopontine nucleus in human gait.
Lau B, Welter ML, Belaid H, Fernandez Vidal S, Bardinet E, Grabli D, Karachi C. Lau B, et al. Brain. 2015 May;138(Pt 5):1284-96. doi: 10.1093/brain/awv047. Epub 2015 Mar 12. Brain. 2015. PMID: 25765327 Free PMC article. - Inhibition of midbrain cholinergic neurons impairs decision-making strategies during reversal learning.
Kim Y, Gut NK, Shiflett MW, Mena-Segovia J. Kim Y, et al. Front Mol Neurosci. 2024 Nov 21;17:1481956. doi: 10.3389/fnmol.2024.1481956. eCollection 2024. Front Mol Neurosci. 2024. PMID: 39640944 Free PMC article. - Functions and computational principles of serotonergic and related systems at multiple scales.
Nakamura K, Wong-Lin K. Nakamura K, et al. Front Integr Neurosci. 2014 Mar 7;8:23. doi: 10.3389/fnint.2014.00023. eCollection 2014. Front Integr Neurosci. 2014. PMID: 24639632 Free PMC article. No abstract available. - Direct localisation of the human pedunculopontine nucleus using MRI: a coordinate and fibre-tracking study.
Cong F, Wang JW, Wang B, Yang Z, An J, Zuo Z, Zhang Z, Zhang YQ, Zhuo Y. Cong F, et al. Eur Radiol. 2018 Sep;28(9):3882-3892. doi: 10.1007/s00330-017-5299-5. Epub 2018 Mar 12. Eur Radiol. 2018. PMID: 29532240 - Modulation of Dopamine for Adaptive Learning: A Neurocomputational Model.
Inglis JB, Valentin VV, Ashby FG. Inglis JB, et al. Comput Brain Behav. 2021 Mar;4(1):34-52. doi: 10.1007/s42113-020-00083-x. Epub 2020 Jun 12. Comput Brain Behav. 2021. PMID: 34151186 Free PMC article.
References
- Beninato M., Spencer R. F. (1987). A cholinergic projection to the rat substantia nigra from the pedunculopontine tegmental nucleus. Brain Res. 412 169–174 - PubMed
LinkOut - more resources
Full Text Sources
Other Literature Sources

