Characterizing and measuring bias in sequence data - PubMed (original) (raw)
Characterizing and measuring bias in sequence data
Michael G Ross et al. Genome Biol. 2013.
Abstract
Background: DNA sequencing technologies deviate from the ideal uniform distribution of reads. These biases impair scientific and medical applications. Accordingly, we have developed computational methods for discovering, describing and measuring bias.
Results: We applied these methods to the Illumina, Ion Torrent, Pacific Biosciences and Complete Genomics sequencing platforms, using data from human and from a set of microbes with diverse base compositions. As in previous work, library construction conditions significantly influence sequencing bias. Pacific Biosciences coverage levels are the least biased, followed by Illumina, although all technologies exhibit error-rate biases in high- and low-GC regions and at long homopolymer runs. The GC-rich regions prone to low coverage include a number of human promoters, so we therefore catalog 1,000 that were exceptionally resistant to sequencing. Our results indicate that combining data from two technologies can reduce coverage bias if the biases in the component technologies are complementary and of similar magnitude. Analysis of Illumina data representing 120-fold coverage of a well-studied human sample reveals that 0.20% of the autosomal genome was covered at less than 10% of the genome-wide average. Excluding locations that were similar to known bias motifs or likely due to sample-reference variations left only 0.045% of the autosomal genome with unexplained poor coverage.
Conclusions: The assays presented in this paper provide a comprehensive view of sequencing bias, which can be used to drive laboratory improvements and to monitor production processes. Development guided by these assays should result in improved genome assemblies and better coverage of biologically important loci.
Figures
Figure 1
Diagram illustrating the low coverage of NCS1 exon 1 in 198× Illumina HiSeq shotgun data. The first 72 bases of the first exon of human gene NCS1, including the transcription start site, were uncovered in a 198× whole-genome shotgun data set (#A2). The displayed 2,000 base region is chromosome 9:132,933,910-132,935,910. NCS1 encodes calcium-binding proteins that regulate neurotransmitter release [1].
Figure 2
GC-bias plots for three microbial genomes. Top: plots showing the relative coverage GC-bias for Illumina MiSeq, Ion Torrent PGM, and Pacific Biosciences RS on the P. falciparum (19% GC), E. coli (51%), and R. sphaeroides (69%) genomes (Table 2, data sets 1 to 9). Unbiased coverage would be represented by a horizontal line at a relative coverage = 1 (black dashed line). Relative coverage is only plotted for GC percentages for which there are at least 1,000 100-base windows in the genome. Bottom: the GC composition distribution of each genome.
Figure 3
GC-bias plots for the human genome. Left: the GC composition distribution of the human genome (HG19, GRCh37). Center and right: GC-bias plots for several data sets from human NA12878. Unbiased coverage would be represented by a horizontal line at relative coverage = 1. Center: HiSeq v3 with sample-preparation reagents from Kapa Biosystems (Table 2, data set 14), Ion Torrent PGM (data set 15), and Complete Genomics data (data set 16). Right: HiSeq v3 with sample-preparation reagents from Kapa Biosystems (data set 14, as in center panel) and HiSeq v3 with the standard Fisher et al. [31] reagents (data set 13). Note that Illumina relative coverage exceeded the y-axis above 93% GC content. Relative coverage is only plotted for GC percentages for which there are at least 1,000 100-base windows in the genome.
Figure 4
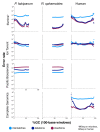
Error rates as a function of GC composition. Each graph shows mismatch (light blue), deletion (dark blue), and insertion (maroon) rates (y-axis) as a function of GC composition (x-axis). Data are shown for the Ion Torrent PGM from three organisms (P. falciparum, R. sphaeroides, and human), for the Illumina MiSeq on the two microbes, for the Illumina HiSeq on human, for Pacific Biosciences from the two microbes and from Complete Genomics for human (Table 2, data sets 1 to 3, 7 to 9, and 14 to 16). For human we note that bona fide differences between the sample and the reference sequence were recorded as errors. Error rates are only plotted for GC percentages for which there are at least 1,000 100-base windows in the genome.
Figure 5
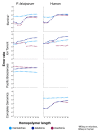
Error rates as a function of homopolymer length. Each graph shows mismatch (light blue), deletion (dark blue), and insertion (maroon) rates (y-axis) within homopolymers of various lengths (x-axis). Data are plotted from P. falciparum and human as available (Table 2, data sets 1 to 3 and 14 to 16). For human we note that bona fide differences between the sample and the reference sequence were recorded as errors.
Figure 6
GC and homopolymer distributions of uncharacterized Illumina undercoverage of human sample NA12878. The graphs show the distribution of GC-content and homopolymer length for bases in the overall human genome and in the genome intervals that are ten-fold undercovered but which were not explained by known sequence biases or differences between the sample and reference sequence. Data are from Table 2, data set 14.
Similar articles
- A tale of three next generation sequencing platforms: comparison of Ion Torrent, Pacific Biosciences and Illumina MiSeq sequencers.
Quail MA, Smith M, Coupland P, Otto TD, Harris SR, Connor TR, Bertoni A, Swerdlow HP, Gu Y. Quail MA, et al. BMC Genomics. 2012 Jul 24;13:341. doi: 10.1186/1471-2164-13-341. BMC Genomics. 2012. PMID: 22827831 Free PMC article. - Evaluation of strategies for the assembly of diverse bacterial genomes using MinION long-read sequencing.
Goldstein S, Beka L, Graf J, Klassen JL. Goldstein S, et al. BMC Genomics. 2019 Jan 9;20(1):23. doi: 10.1186/s12864-018-5381-7. BMC Genomics. 2019. PMID: 30626323 Free PMC article. - An evaluation of the PacBio RS platform for sequencing and de novo assembly of a chloroplast genome.
Ferrarini M, Moretto M, Ward JA, Šurbanovski N, Stevanović V, Giongo L, Viola R, Cavalieri D, Velasco R, Cestaro A, Sargent DJ. Ferrarini M, et al. BMC Genomics. 2013 Oct 1;14:670. doi: 10.1186/1471-2164-14-670. BMC Genomics. 2013. PMID: 24083400 Free PMC article. - Computational methods for discovering structural variation with next-generation sequencing.
Medvedev P, Stanciu M, Brudno M. Medvedev P, et al. Nat Methods. 2009 Nov;6(11 Suppl):S13-20. doi: 10.1038/nmeth.1374. Nat Methods. 2009. PMID: 19844226 Review. - Current state-of-art of sequencing technologies for plant genomics research.
Thudi M, Li Y, Jackson SA, May GD, Varshney RK. Thudi M, et al. Brief Funct Genomics. 2012 Jan;11(1):3-11. doi: 10.1093/bfgp/elr045. Brief Funct Genomics. 2012. PMID: 22345601 Review.
Cited by
- Sources of PCR-induced distortions in high-throughput sequencing data sets.
Kebschull JM, Zador AM. Kebschull JM, et al. Nucleic Acids Res. 2015 Dec 2;43(21):e143. doi: 10.1093/nar/gkv717. Epub 2015 Jul 17. Nucleic Acids Res. 2015. PMID: 26187991 Free PMC article. - Metagenomic approaches in microbial ecology: an update on whole-genome and marker gene sequencing analyses.
Pérez-Cobas AE, Gomez-Valero L, Buchrieser C. Pérez-Cobas AE, et al. Microb Genom. 2020 Aug;6(8):mgen000409. doi: 10.1099/mgen.0.000409. Epub 2020 Jul 24. Microb Genom. 2020. PMID: 32706331 Free PMC article. Review. - VariantBam: filtering and profiling of next-generational sequencing data using region-specific rules.
Wala J, Zhang CZ, Meyerson M, Beroukhim R. Wala J, et al. Bioinformatics. 2016 Jul 1;32(13):2029-31. doi: 10.1093/bioinformatics/btw111. Epub 2016 Feb 26. Bioinformatics. 2016. PMID: 27153727 Free PMC article. - Normalization benchmark of ATAC-seq datasets shows the importance of accounting for GC-content effects.
Van den Berge K, Chou HJ, Roux de Bézieux H, Street K, Risso D, Ngai J, Dudoit S. Van den Berge K, et al. Cell Rep Methods. 2022 Nov 1;2(11):100321. doi: 10.1016/j.crmeth.2022.100321. eCollection 2022 Nov 21. Cell Rep Methods. 2022. PMID: 36452861 Free PMC article. - LongISLND: in silico sequencing of lengthy and noisy datatypes.
Lau B, Mohiyuddin M, Mu JC, Fang LT, Bani Asadi N, Dallett C, Lam HY. Lau B, et al. Bioinformatics. 2016 Dec 15;32(24):3829-3832. doi: 10.1093/bioinformatics/btw602. Epub 2016 Sep 25. Bioinformatics. 2016. PMID: 27667791 Free PMC article.
References
- Quail M, Smith ME, Coupland P, Otto TD, Harris SR, Connor TR, Bertoni A, Swerdlow HP, Gu Y. A tale of three next generation sequencing platforms: comparison of Ion torrent, pacific biosciences and illumina MiSeq sequencers. BMC Genomics. 2012;14:341. doi: 10.1186/1471-2164-13-341. - DOI - PMC - PubMed
Publication types
MeSH terms
LinkOut - more resources
Full Text Sources
Other Literature Sources
Research Materials
Miscellaneous


