Oligodendrocyte transcription factor 1 (Olig1) is a Smad cofactor involved in cell motility induced by transforming growth factor-β - PubMed (original) (raw)
Oligodendrocyte transcription factor 1 (Olig1) is a Smad cofactor involved in cell motility induced by transforming growth factor-β
Mitsuyoshi Motizuki et al. J Biol Chem. 2013.
Abstract
Transforming growth factor (TGF)-β plays crucial roles in embryonic development and adult tissue homeostasis by eliciting various cellular responses in target cells. TGF-β signaling is principally mediated through receptor-activated Smad proteins, which regulate expression of target genes in cooperation with other DNA-binding transcription factors (Smad cofactors). In this study, we found that the basic helix-loop-helix transcription factor Olig1 is a Smad cofactor involved in TGF-β-induced cell motility. Knockdown of Olig1 attenuated TGF-β-induced cell motility in chamber migration and wound healing assays. In contrast, Olig1 knockdown had no effect on bone morphogenetic protein-induced cell motility, TGF-β-induced cytostasis, or epithelial-mesenchymal transition. Furthermore, we observed that cooperation of Smad2/3 with Olig1 is regulated by a peptidyl-prolyl cis/trans-isomerase, Pin1. TGF-β-induced cell motility, induction of Olig1-regulated genes, and physical interaction between Smad2/3 and Olig1 were all inhibited after knockdown of Pin1, indicating a novel mode of regulation of Smad signaling. We also found that Olig1 interacts with the L3 loop of Smad3. Using a synthetic peptide corresponding to the L3 loop of Smad3, we succeeded in selectively inhibiting TGF-β-induced cell motility. These findings may lead to a new strategy for selective regulation of TGF-β-induced cellular responses.
Keywords: Cell Motility; Prolyl Isomerase; Signal Transduction; Smad Transcription Factor; Transforming Growth Factor-β.
Figures
FIGURE 1.
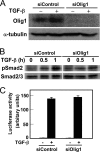
Knockdown of Olig1 does not affect the principal events in TGF-β signaling. A, knockdown of Olig1 in NMuMG mouse mammary epithelial cells. Cells were transfected with a negative control RNA or Olig1 siRNA (siControl or siOlig1, respectively). Sixteen h later, cells were stimulated with TGF-β for 24 h and harvested. Expression of Olig1 was determined by immunoblotting. Expression of tubulin is also shown as a loading control. B, effects of Olig1 knockdown on TGF-β-induced phosphorylation of Smad2. NMuMG cells were transfected with control or Olig1 siRNA. Thirty-six h later, cells were stimulated with TGF-β for 0.5–1 h and harvested. Levels of C-terminally phosphorylated Smad2, as well as total Smad2/3, were determined by immunoblotting. C, effects of Olig1 knockdown on TGF-β-induced transactivation of (CAGA)12-MLP-Luc. NMuMG cells were transfected with control or Olig1 siRNA. Thirty h later, cells were transfected with luciferase reporter constructs, stimulated with TGF-β for 24 h, and harvested. Error bars represent S.D.
FIGURE 2.
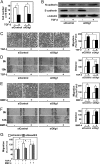
Knockdown of Olig1 selectively impairs cell motility induced by TGF-β. Cells were transfected with control or Olig1 siRNA. After 16 h, cells were used in the indicated assays. A, effects of Olig1 knockdown on TGF-β-induced cytostasis in NMuMG cells. Cells were treated with TGF-β (1 ng/ml) for 48 h and counted. siControl denotes a negative control oligonucleotide. Error bars represent S.D. B, effects of Olig1 knockdown on TGF-β-induced EMT. Cells were stimulated with TGF-β (1 ng/ml) for 24 h after knockdown of Olig1. Protein expression of a mesenchymal marker, N-cadherin (top panel) and an epithelial marker, E-cadherin (middle panel), are depicted. The bottom panel shows expression level of tubulin protein, as a loading control. C and E, chamber migration assay. Cells were stimulated with TGF-β (1 ng/ml, C) or BMP-4 (10 ng/ml, E). D and F, wound healing assay. Cells were stimulated with TGF-β (1 ng/ml, D) or BMP-4 (10 ng/ml, F). Quantitations are shown in the right. p values were determined by Student's t test. *, p < 0.01. G, effect of Smad2/3 knockdown on TGF-β-induced cell motility in chamber migration assay. Cells were transfected with control or Smad2/3 siRNA. After 48 h, cells were used in chamber migration assay.
FIGURE 3.
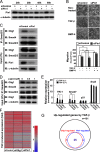
Pin1 regulates cooperative action of Smad and Olig1. A, knockdown of Pin1 in NMuMG cells. Cells were transfected with control or Pin1 siRNA and harvested at the indicated times. Expression of Pin1 and α-tubulin (as a loading control) was analyzed by immunoblotting. In the following experiments, cells transfected for 48 h are used in each assay. B, knockdown of Pin1 inhibiting TGF-β-induced cell migration in a chamber migration assay. Cells were treated with TGF-β (1 ng/ml) or BMP-4 (10 ng/ml) for 12 h and subjected to chamber migration assays. Quantification is shown in the panel below. C, effects of Pin1 knockdown on Smad-Olig1 interaction. NMuMG cells were transfected with FLAG-tagged Olig1. Twenty-four h later, cells were stimulated with TGF-β (1 ng/ml) for 1 h and harvested. Cell lysates were subjected to immunoprecipitation (IP) with anti-Smad2/3 antibody, and co-precipitated Olig1 or Smad4 was visualized by immunoblotting (IB). D, effects of juglone, a Pin1 inhibitor, on Smad-Olig1 interaction. Cells were transfected with FLAG-tagged Olig1, treated with juglone (0.5–1.0 μ
m
) for 24 h, stimulated with TGF-β (1 ng/ml) for 1 h, and harvested. Co-precipitation assay was performed as in C. E, effects of Pin1 knockdown on expression of TGF-β target genes. After knockdown of Pin1, cells were treated with TGF-β (1 ng/ml) for 1 h and harvested; mRNA levels of target genes were measured by quantitative real-time PCR. p values were determined by Student's t test. *, p < 0.05; **, _p_ < 0.01. _F_, heat map of TGF-β-induced expression of target genes. Cells were transfected with control, Olig1, or Pin1 siRNA. After stimulation with TGF-β for 1 h, cells were harvested and subjected to DNA microarray analysis. Genes induced by TGF-β >1.6-fold in the siControl sample (151 genes) are shown. G, Venn diagram showing the overlap of Olig1-regulated genes and Pin1-regulated genes. Genes whose -fold induction by TGF-β were decreased by <0.7 after knockdown of Olig1 or Pin1 (siOlig1 or siPin1 fold/siControl fold < 0.7) are classified as Olig1-regulated genes or Pin1-regulated genes, respectively.
FIGURE 4.
Pin1 targets linker-phosphorylated Smad3. A, in vitro interaction of GST-Pin1 with Olig1. NMuMG cells were transfected with FLAG-Smad3, Smad3–4A, or Olig1 24 h before harvest. Cell lysates were incubated with GST-Pin1 or GST and subjected to GST pulldown followed by immunoblotting (IB) with an anti-FLAG antibody. The top two panels display input protein expression and the interaction. The bottom panel shows GST-Pin1 or GST visualized by Coomassie Brilliant Blue (CBB) staining. B, effect of mutation in linker phosphorylation sites of Smad3 on its interaction with Olig1. NMuMG cells were transfected with the indicated plasmids. Twenty-four h later, cells were stimulated with TGF-β (1 ng/ml) for 1 h and harvested. Cell lysates were subjected to immunoprecipitation (IP) with an anti-FLAG antibody, followed by immunoblotting. The top two panels display precipitated proteins, and the bottom panel shows expression of Olig1. C, effects of kinase inhibitors on Smad-Olig1 interaction. Cells were transfected with FLAG-tagged Olig1, treated with 1 μ
m
flavopiridol or 10 m
m
LiCl for 1 h, stimulated with 1 ng/ml TGF-β for 1 h, and harvested. Cell lysates were subjected to immunoprecipitation with anti-Smad2/3 antibody, and co-precipitated Olig1 or Smad4 was visualized by immunoblotting. D, effects of Pin1 knockdown on interaction between Olig1 and Smad3 truncated mutants. NMuMG cells were transfected with control or Pin1 siRNA. Twenty-four h later, cells were then transfected with indicated plasmids together with constitutively active forms of TGF-β type I receptor (ALK-5). Twenty-four h later, cells were harvested and cell lysates were subjected to immunoprecipitation with an anti-Myc antibody, followed by immunoblotting. The top two panels display precipitated proteins, and the bottom three panels show expression of Smad4, Olig1, or Pin1.
FIGURE 5.
Mapping of the Olig1-binding region in Smad3. A, physical interaction of Olig1 with Smad1/3 chimeric proteins. COS-7 cells were transfected with FLAG-Olig1 and 6Myc-Smad1/3 chimeric proteins, together with constitutively active forms of BMP receptor type IB (ALK-6) and TGF-β type I receptor (ALK-5). Chimeric proteins used are schematically presented in the top panel. Domains or regions derived from Smad1 are shown as open boxes; those from Smad3 are shown as filled boxes. Smad was not transfected into the sample in lane 1. Olig1 was immunoprecipitated (IP) with anti-FLAG antibody; co-precipitated Smad1/3 chimeric proteins were visualized by immunoblotting (IB, middle panels). Input and C-terminal phosphorylation of Smad1/3 chimeric proteins are also shown (bottom panel). B, alignment of amino acid sequences of the region 4 of Smad1 and Smad3. Diverged residues are shown in bold. C, physical interaction of Olig1 with Smad1 mutants, Smad1–1113 (Smad1 with region 4 of the MH2 domain from Smad3), Smad1(H425R,D428T) or Smad1(I438L,H441N). COS-7 cells were transfected with FLAG-Olig1 and 6Myc-Smad1 mutants, together with constitutively active TGF-β type I receptor (ALK-5) and BMP receptor type IB (ALK-6). Smad1 mutants were immunoprecipitated with anti-Myc antibody; co-precipitated Olig1 was visualized by immunoblotting. Input of Olig1 is also shown (bottom panel). D, physical interaction of Olig1 with a Smad3 mutant (R385H,T388D). COS-7 cells were transfected with FLAG-Smad3 or Smad3(R385H,T388D) and 6Myc-Olig1, together with constitutively active TGF-β type I receptor (ALK-5) and BMP receptor type IB (ALK-6). Smad3 was immunoprecipitated with anti-FLAG antibody; co-precipitated Olig1 was visualized by immunoblotting. Input of Olig1 is also shown (bottom panel). E, in vitro interaction of GST-Pin1 with a Smad3 mutant (R385H,T388D). COS-7 cells were transfected with FLAG-Smad3 or Smad3 mutant (R385H,T388D) 24 h before harvest. Cell lysates were then incubated with GST-Pin1 or GST, and subjected to GST pulldown followed by immunoblotting with an anti-FLAG antibody. The top panel displays input protein expression and the interaction. The lower panel shows GST-Pin1 or GST visualized by Coomassie Brilliant Blue (CBB) staining. F, three-dimensional structural model of the MH2 domain of the phospho-Smad3–phospho-Smad3–Smad4 trimeric complex (Protein Databank code 1U7F). The left panel shows a view from the C-terminal side of the trimeric complex. The right panel shows a side view (the C-terminal side is placed upward). The C-terminally phosphorylated serine residues are shown in yellow; the Olig1-binding determinant is shown in green.
FIGURE 6.
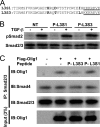
A peptide blocker P-L3S3 inhibits the Smad-Olig1 interaction. A, primary sequences of peptide blockers P-L3S3 and P-L3S1. Diverged amino acid residues are shown in bold. The nuclear localization signal attached to the C terminus is underlined. B, phosphorylation of Smad2 in response to TGF-β stimulation in the presence of peptide blockers. NMuMG cells were transfected with P-L3S1 and P-L3S3. Four h later, cells were stimulated with TGF-β (1 ng/ml) for 1 h followed by immunoblotting analysis. C, effects of peptide blockers on physical interaction of Olig1 with Smad2/3. NMuMG cells were transfected with FLAG-tagged Olig1, and 12 h later they were transfected with peptides. Eleven h later, cells were stimulated with TGF-β for 1 h and harvested. Cell lysates were subjected to immunoprecipitation with anti-Smad2/3 antibody; co-precipitated Olig1 and Smad4 were visualized by immunoblotting (IB).
FIGURE 7.
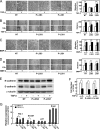
P-L3S3 selectively inhibits TGF-β-induced cell motility. Cells were transfected with peptide P-L3S3 or P-L3S1 using a protein transfection reagent. Four h later, cells were subjected to the indicated assays. A and C, chamber migration assay. Cells were stimulated with TGF-β (1 ng/ml, A) or BMP-4 (10 ng/ml, C). B and D, wound healing assay. Cells were stimulated with TGF-β (1 ng/ml, B) or BMP-4 (10 ng/ml, D). Quantitations are shown at the right. NT denotes no-treatment control (without peptide transfection). E, TGF-β-induced EMT. Expression of N-cadherin (a mesenchymal marker, top panel), and E-cadherin (an epithelial marker, middle), and α-tubulin (a loading control, bottom) is shown. F, TGF-β-induced cytostasis. Cells were treated with TGF-β for 48 h and counted. G, expression of target genes of TGF-β. Cells were treated with 1 ng/ml TGF-β for 1 h, harvested, and mRNA levels of target genes were measured by quantitative real-time PCR. p values were determined by Student's t test. *, p < 0.05; **, p < 0.01. Error bars, S.D.
FIGURE 8.
Interaction surfaces with cofactors on Smad3. Three-dimensional model of the MH2 domain of the phospho-Smad3–phospho-Smad3–Smad4 trimeric complex (Protein Data Bank ID code 1U7F) in ribbon format. Smad4 is not shown here. Smad3 proteins are shown in pink and dark pink. The N-terminal residue of the MH2 domain is shown in blue. Binding sites for FoxH1, c-Ski, and Olig1 are shown in yellow, red, and green, respectively. Dotted lines denote the amino acids residues of the linker region.
Similar articles
- An Id-like molecule, HHM, is a synexpression group-restricted regulator of TGF-beta signalling.
Ikushima H, Komuro A, Isogaya K, Shinozaki M, Hellman U, Miyazawa K, Miyazono K. Ikushima H, et al. EMBO J. 2008 Nov 19;27(22):2955-65. doi: 10.1038/emboj.2008.218. Epub 2008 Oct 16. EMBO J. 2008. PMID: 18923419 Free PMC article. - Pin1 down-regulates transforming growth factor-beta (TGF-beta) signaling by inducing degradation of Smad proteins.
Nakano A, Koinuma D, Miyazawa K, Uchida T, Saitoh M, Kawabata M, Hanai J, Akiyama H, Abe M, Miyazono K, Matsumoto T, Imamura T. Nakano A, et al. J Biol Chem. 2009 Mar 6;284(10):6109-15. doi: 10.1074/jbc.M804659200. Epub 2009 Jan 4. J Biol Chem. 2009. PMID: 19122240 - Pin1 promotes transforming growth factor-beta-induced migration and invasion.
Matsuura I, Chiang KN, Lai CY, He D, Wang G, Ramkumar R, Uchida T, Ryo A, Lu K, Liu F. Matsuura I, et al. J Biol Chem. 2010 Jan 15;285(3):1754-64. doi: 10.1074/jbc.M109.063826. Epub 2009 Nov 17. J Biol Chem. 2010. PMID: 19920136 Free PMC article. - TGF-beta signal transduction in corneal wound healing as a therapeutic target.
Saika S. Saika S. Cornea. 2004 Nov;23(8 Suppl):S25-30. doi: 10.1097/01.ico.0000136668.41000.73. Cornea. 2004. PMID: 15448476 Review. - Biology of transforming growth factor-β signaling.
Ikushima H, Miyazono K. Ikushima H, et al. Curr Pharm Biotechnol. 2011 Dec;12(12):2099-107. doi: 10.2174/138920111798808419. Curr Pharm Biotechnol. 2011. PMID: 21619537 Review.
Cited by
- Endothelial-specific depletion of TGF-β signaling affects lymphatic function.
Fukasawa K, Hanada K, Ichikawa K, Hirashima M, Takagi T, Itoh S, Watabe T, Itoh F. Fukasawa K, et al. Inflamm Regen. 2021 Dec 1;41(1):35. doi: 10.1186/s41232-021-00185-4. Inflamm Regen. 2021. PMID: 34847944 Free PMC article. - Astrocytic TGF-β signaling limits inflammation and reduces neuronal damage during central nervous system Toxoplasma infection.
Cekanaviciute E, Dietrich HK, Axtell RC, Williams AM, Egusquiza R, Wai KM, Koshy AA, Buckwalter MS. Cekanaviciute E, et al. J Immunol. 2014 Jul 1;193(1):139-49. doi: 10.4049/jimmunol.1303284. Epub 2014 May 23. J Immunol. 2014. PMID: 24860191 Free PMC article. - miR-136 modulates TGF-β1-induced proliferation arrest by targeting PPP2R2A in keratinocytes.
Zhang D, Wang J, Wang Z, Zhang T, Shi P, Wang X, Zhao F, Liu X, Lin X, Pang X. Zhang D, et al. Biomed Res Int. 2015;2015:453518. doi: 10.1155/2015/453518. Epub 2015 Jan 14. Biomed Res Int. 2015. PMID: 25654102 Free PMC article. - Phosphorylation status at Smad3 linker region modulates transforming growth factor-β-induced epithelial-mesenchymal transition and cancer progression.
Ooshima A, Park J, Kim SJ. Ooshima A, et al. Cancer Sci. 2019 Feb;110(2):481-488. doi: 10.1111/cas.13922. Epub 2019 Jan 23. Cancer Sci. 2019. PMID: 30589983 Free PMC article. Review. - Zoledronic acid suppresses transforming growth factor-β-induced fibrogenesis by human gingival fibroblasts.
Komatsu Y, Ibi M, Chosa N, Kyakumoto S, Kamo M, Shibata T, Sugiyama Y, Ishisaki A. Komatsu Y, et al. Int J Mol Med. 2016 Jul;38(1):139-47. doi: 10.3892/ijmm.2016.2582. Epub 2016 May 10. Int J Mol Med. 2016. PMID: 27176567 Free PMC article.
References
- Ikushima H., Miyazono K. (2010) TGFβ signalling: a complex web in cancer progression. Nat. Rev. Cancer 10, 415–424 - PubMed
Publication types
MeSH terms
Substances
LinkOut - more resources
Full Text Sources
Other Literature Sources
Molecular Biology Databases
Miscellaneous
