Atrial identity is determined by a COUP-TFII regulatory network - PubMed (original) (raw)
Atrial identity is determined by a COUP-TFII regulatory network
San-pin Wu et al. Dev Cell. 2013.
Abstract
Atria and ventricles exhibit distinct molecular profiles that produce structural and functional differences between the two cardiac compartments. However, the factors that determine these differences remain largely undefined. Cardiomyocyte-specific COUP-TFII ablation produces ventricularized atria that exhibit ventricle-like action potentials, increased cardiomyocyte size, and development of extensive T tubules. Changes in atrial characteristics are accompanied by alterations of 2,584 genes, of which 81% were differentially expressed between atria and ventricles, suggesting that a major function of myocardial COUP-TFII is to determine atrial identity. Chromatin immunoprecipitation assays using E13.5 atria identified classic atrial-ventricular identity genes Tbx5, Hey2, Irx4, MLC2v, MLC2a, and MLC1a, among many other cardiac genes, as potential COUP-TFII direct targets. Collectively, our results reveal that COUP-TFII confers atrial identity through direct binding and by modulating expression of a broad spectrum of genes that have an impact on atrial development and function.
Copyright © 2013 Elsevier Inc. All rights reserved.
Figures
Figure 1. Morphology of the ventricularized atria
(A–J) Hearts of 2 months old adult mice staining for MLC2a and MLC2v in denoted genotypes. Hematoxylin was utilized for counterstaining. Scale bars indicate 500 µm. (K–L) Bar graphs showing mean length (K) and width (L) of isolated cardiomyocytes. (M–O) Confocal fluorescent images of representative di-8-ANEPPS-stained myocytes with genotypes denoted at side. (P) Index of the spatial integrity of T-Tubules (TT-power). Each genotype comprised of 3 animals at 2 months old. Error bars denote standard error of mean. ***, p<0.001. ra, right atria; rv, right ventricles; la, left atria; lv, left ventricles. See also Figure S1.
Figure 2. Molecular profile of ventricularized atria in CKO hearts
(A) Venn diagram to compare the genes up-regulated in CKO atria (black circle) and ventricular genes (grey circle). (B) Venn diagram to compare the genes down-regulated in CKO atria (black circle) and atrial genes (grey circle). (C–H) Relative mRNA levels of marker genes in adult atria (n=4 for each genotype). Error bars denote standard error of mean. ***, p<0.001. See also Tables S1, S2 and S3.
Figure 3. Electric properties of adult CKO myocytes and hearts
(A–C) Representative diagrams of action potential recording from isolated CTRLA (A), CKOA (B) and CTRLV (C) myocytes. (D) Mean action potential durations of isolated cardiomyocytes at APD90. (E&F) Representative surface and intra-atrial ECG during programmed induction of AF in CTRL (E) and CKO (F) mice. N (numbers of cells) =15 for CTRLA, 15 for CKOA and 7 for CTRLV within each bar from 3 animals per group. Error bars denote standard error of mean. ***, p<0.001; mV, millivolt; ms, millisecond. See also Figure S2 and Tables S4 and S5.
Figure 4. Temporal analysis of identity switch
(A–H) Heart regions of CKO and control mice stained for MLC2v with age denoted on the side. (I) qRTPCR for MLC2v mRNA levels in atria from E9.5 to 2 months old adult mice. Fold changes of CKO are normalized to the corresponding control at the same age. Asterisks denote significant differences between genotypes of the same age. (J–M) Heart regions E18.5 of CKOMyh6-MCM and corresponding control mice stained for MLC2v. E18.5TamE12.5 and E18.5TamE15.5, embryos received tamoxifen at E12.5 and E15.5, respectively. Inserts in (K&M), double staining of MLC2v (red) and β-gal (green) with DAPI for nuclei staining on an adjacent section of (K&M), respectively. Hematoxylin was utilized for counterstaining in all sections except inserts in (K& M). Error bars denote standard error of mean. ***, p<0.001. ra, right atria; rv, right ventricles; la, left atria; lv, left ventricles. See also Figure S3.
Figure 5. Regulation of atrial/ventricular identity transcription factors by COUP-TFII
(A–I) Relative mRNA levels of denoted genes from pooled E14.5 CTRL (solid bar) and CKO (open bar) atria measured by qPCR. Each group comprised two independent pools of atrial samples. Levels were shown as relative folds over control. (J–L) ChIP-PCR assays on pooled E13.5 atria using anti-COUP-TFII antibody (solid bar) or IgG (open bar). Diagrams on the top indicated COUP-TFII binding sites. Bar graphs show enrichment of DNA fragments pulled down by antibodies. N indicates a region in the Hbb locus without COUP-TFII or Sp1 binding sites served as negative control. Error bars denote standard error of mean. *, p<0.05; **, p<0.01; ***, p<0.001. See also Figure S4.
Figure 6. Identification of global COUP-TFII binding targets in atria
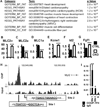
(A) Enriched functional annotation terms by DAVID Bioinformatics Sources from ChIP-seq identified genes that contain COUP-TFII binding sites in E13.5 atria. (B–G) Expression levels of denoted genes in E14.5 CKO atria compared with control. (H) The ChIP-seq result of COUP-TFII binding in the MLC2v (Myl2) locus. COUP-TFII binding motifs are shown in capital letters in boxes. (I) ChIP-qPCR results on pooled E13.5 atria using anti-COUP-TFII antibody (solid bar) or IgG (open bar). Bar graphs show enrichment of DNA fragments pulled down by antibodies. N indicates a region in the Hbb locus without COUP-TFII binding sites served as negative control. Error bars denote standard error of mean. *, p<0.05; **, p<0.01; ***, p<0.001. See also Figure S5 and Table S6.
Figure 7. Atrialized ventricular myocytes by COUP-TFII overexpression
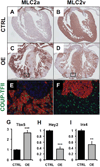
Adjacent coronal sections of E17.5 control (A & B) and COUP-TFII overexpression (C & D) hearts stained for MLC2a (A & C) and MLC2v (B & D). (E & F) High power view of adjacent section corresponding to areas being bracketed in (C and D) that are double-stained for COUP-TFII (green) with MLC2a (E) or MLC2v (F) in red. Nuclei were stained in blue by DAPI. (G–I) Relative mRNA levels of Tbx5 (G), Hey2 (H) and Irx4 (I) from E17.5 CTRL (black bar) and COUP-TFII overexpression (OE, grey bar) ventricles measured by qRTPCR. Each groups consisted of 3 individual ventricles. Levels are shown as relative folds over control. Error bars denote standard error of mean. **, p<0.01; ***, p<0.001.
Similar articles
- CHF1/Hey2 plays a pivotal role in left ventricular maturation through suppression of ectopic atrial gene expression.
Koibuchi N, Chin MT. Koibuchi N, et al. Circ Res. 2007 Mar 30;100(6):850-5. doi: 10.1161/01.RES.0000261693.13269.bf. Epub 2007 Mar 1. Circ Res. 2007. PMID: 17332425 - Tbx20 Is Required in Mid-Gestation Cardiomyocytes and Plays a Central Role in Atrial Development.
Boogerd CJ, Zhu X, Aneas I, Sakabe N, Zhang L, Sobreira DR, Montefiori L, Bogomolovas J, Joslin AC, Zhou B, Chen J, Nobrega MA, Evans SM. Boogerd CJ, et al. Circ Res. 2018 Aug 3;123(4):428-442. doi: 10.1161/CIRCRESAHA.118.311339. Circ Res. 2018. PMID: 29903739 Free PMC article. - A COUP-TFII Human Embryonic Stem Cell Reporter Line to Identify and Select Atrial Cardiomyocytes.
Schwach V, Verkerk AO, Mol M, Monshouwer-Kloots JJ, Devalla HD, Orlova VV, Anastassiadis K, Mummery CL, Davis RP, Passier R. Schwach V, et al. Stem Cell Reports. 2017 Dec 12;9(6):1765-1779. doi: 10.1016/j.stemcr.2017.10.024. Epub 2017 Nov 22. Stem Cell Reports. 2017. PMID: 29173897 Free PMC article. - Myocardial Pitx2 differentially regulates the left atrial identity and ventricular asymmetric remodeling programs.
Tessari A, Pietrobon M, Notte A, Cifelli G, Gage PJ, Schneider MD, Lembo G, Campione M. Tessari A, et al. Circ Res. 2008 Apr 11;102(7):813-22. doi: 10.1161/CIRCRESAHA.107.163188. Epub 2008 Feb 21. Circ Res. 2008. PMID: 18292603 - Choose your destiny: Make a cell fate decision with COUP-TFII.
Wu SP, Yu CT, Tsai SY, Tsai MJ. Wu SP, et al. J Steroid Biochem Mol Biol. 2016 Mar;157:7-12. doi: 10.1016/j.jsbmb.2015.11.011. Epub 2015 Dec 2. J Steroid Biochem Mol Biol. 2016. PMID: 26658017 Free PMC article. Review.
Cited by
- Tbx5 maintains atrial identity in post-natal cardiomyocytes by regulating an atrial-specific enhancer network.
Sweat ME, Cao Y, Zhang X, Burnicka-Turek O, Perez-Cervantes C, Arulsamy K, Lu F, Keating EM, Akerberg BN, Ma Q, Wakimoto H, Gorham JM, Hill LD, Kyoung Song M, Trembley MA, Wang P, Gianeselli M, Prondzynski M, Bortolin RH, Bezzerides VJ, Chen K, Seidman JG, Seidman CE, Moskowitz IP, Pu WT. Sweat ME, et al. Nat Cardiovasc Res. 2023 Oct;2(10):881-898. doi: 10.1038/s44161-023-00334-7. Epub 2023 Oct 12. Nat Cardiovasc Res. 2023. PMID: 38344303 Free PMC article. - In vitro generation of functional murine heart organoids via FGF4 and extracellular matrix.
Lee J, Sutani A, Kaneko R, Takeuchi J, Sasano T, Kohda T, Ihara K, Takahashi K, Yamazoe M, Morio T, Furukawa T, Ishino F. Lee J, et al. Nat Commun. 2020 Sep 3;11(1):4283. doi: 10.1038/s41467-020-18031-5. Nat Commun. 2020. PMID: 32883967 Free PMC article. - Identification of atrial fibrillation associated genes and functional non-coding variants.
van Ouwerkerk AF, Bosada FM, van Duijvenboden K, Hill MC, Montefiori LE, Scholman KT, Liu J, de Vries AAF, Boukens BJ, Ellinor PT, Goumans MJTH, Efimov IR, Nobrega MA, Barnett P, Martin JF, Christoffels VM. van Ouwerkerk AF, et al. Nat Commun. 2019 Oct 18;10(1):4755. doi: 10.1038/s41467-019-12721-5. Nat Commun. 2019. PMID: 31628324 Free PMC article. - Reiterative Mechanisms of Retinoic Acid Signaling during Vertebrate Heart Development.
Perl E, Waxman JS. Perl E, et al. J Dev Biol. 2019 May 30;7(2):11. doi: 10.3390/jdb7020011. J Dev Biol. 2019. PMID: 31151214 Free PMC article. Review. - The critical roles of COUP-TFII in tumor progression and metastasis.
Qin J, Tsai SY, Tsai MJ. Qin J, et al. Cell Biosci. 2014 Oct 1;4(1):58. doi: 10.1186/2045-3701-4-58. eCollection 2014. Cell Biosci. 2014. PMID: 25328664 Free PMC article. Review.
References
- Bao ZZ, Bruneau BG, Seidman JG, Seidman CE, Cepko CL. Regulation of chamber-specific gene expression in the developing heart by Irx4. Science. 1999;283:1161–1164. - PubMed
- Barth AS, Merk S, Arnoldi E, Zwermann L, Kloos P, Gebauer M, Steinmeyer K, Bleich M, Kaab S, Pfeufer A, Uberfuhr P, Dugas M, Steinbeck G, Nabauer M. Functional profiling of human atrial and ventricular gene expression. Pflugers Arch. 2005;450:201–208. - PubMed
Publication types
MeSH terms
Substances
Grants and funding
- P01 DK059820/DK/NIDDK NIH HHS/United States
- R01 DK045641/DK/NIDDK NIH HHS/United States
- U19 DK062434/DK/NIDDK NIH HHS/United States
- R01 HL076448/HL/NHLBI NIH HHS/United States
- R37 DK045641/DK/NIDDK NIH HHS/United States
- R25 GM056929/GM/NIGMS NIH HHS/United States
- R01 HL114539/HL/NHLBI NIH HHS/United States
- DK59820/DK/NIDDK NIH HHS/United States
- HL76448/HL/NHLBI NIH HHS/United States
- DK45641/DK/NIDDK NIH HHS/United States
- DK62434/DK/NIDDK NIH HHS/United States
- P30 DK079638/DK/NIDDK NIH HHS/United States
LinkOut - more resources
Full Text Sources
Other Literature Sources
Molecular Biology Databases


