Bivalent chromatin marks developmental regulatory genes in the mouse embryonic germline in vivo - PubMed (original) (raw)
Bivalent chromatin marks developmental regulatory genes in the mouse embryonic germline in vivo
Michael Sachs et al. Cell Rep. 2013.
Abstract
Developmental regulatory genes have both activating (H3K4me3) and repressive (H3K27me3) histone modifications in embryonic stem cells (ESCs). This bivalent configuration is thought to maintain lineage commitment programs in a poised state. However, establishing physiological relevance has been complicated by the high number of cells required for chromatin immunoprecipitation (ChIP). We developed a low-cell-number chromatin immunoprecipitation (low-cell ChIP) protocol to investigate the chromatin of mouse primordial germ cells (PGCs). Genome-wide analysis of embryonic day 11.5 (E11.5) PGCs revealed H3K4me3/H3K27me3 bivalent domains highly enriched at developmental regulatory genes in a manner remarkably similar to ESCs. Developmental regulators remain bivalent and transcriptionally silent through the initiation of sexual differentiation at E13.5. We also identified >2,500 "orphan" bivalent domains that are distal to known genes and expressed in a tissue-specific manner but silent in PGCs. Our results demonstrate the existence of bivalent domains in the germline and raise the possibility that the somatic program is continuously maintained as bivalent, potentially imparting transgenerational epigenetic inheritance.
Copyright © 2013 The Authors. Published by Elsevier Inc. All rights reserved.
Figures
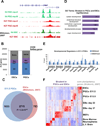
Figure 1. Bivalent genes in E11.5 PGCs are enriched for developmental regulators
(A) Sample UCSC Genome Browser view of ChIP-Seq signal for 2 biological replicates of E11.5 PGCs and for ESCs. (B) E11.5 PGCs and ESCs have a similar number of genes marked by only H3K4me3, only H3K27me3, or both. (C) Overlap of genes marked by H3K4me3 and H3K27me3 in E11.5 PGCs and ESCs, p<2.2×10⁻¹⁶ using Fisher’s exact test. (D) Top 5 biological process gene ontology terms as determined using DAVID for genes marked as bivalent in both PGCs and ESCs. (E) Validation of ChIP-Seq using ChIP-qPCR enrichment for H3K4me3 and H3K27me3 in E11.5 PGCs for a subset of bivalent genes representing regulators of the three germ layers. Data are mean percent of input ± standard deviation of enrichment. The dotted line represents level of background enrichment. (F) Heat map showing expression of the subset of genes marked as bivalent in both PGCs and ESCs in indicated cell types. EBs: embryonic bodies; MEFs: mouse embryonic fibroblasts; L.V. Brain: lateral ventricles of adult brain. Blue indicates down-regulation, red indicates up-regulation. See also Figure S2, Table S1.
Figure 2. PGCs are enriched for bivalent developmental regulators compared to surrounding somatic cells at E11.5
(A) ChIP enrichment for H3K4me3 and H3K27me3 in ESCs at the indicated genes. Data are mean percent of input ± standard deviation of enrichment. The dotted line represents level of background enrichment. (B) ChIP enrichment for H3K4me3 and H3K27me3 in E11.5 soma at the indicated genes as described in (A). (C) The ratio of H3K4me3 to H3K27me3 log2 transformed for the indicated gene for ESCs, E11.5 PGCs, and E11.5 soma. The gray area indicates a ratio less than 2 and greater than 0.5. Genes where enrichment for either H3K4me3 or H3K27me3 is not above background are lighter in color. (D) The log2 of the H3K4me3/H3K27me3 ratio was calculated as in (C) (log2 R_cell type_) for all genes examined independent of enrichment over background. The differences between cell type ratios were calculated as follows: Δ_PGC_=|log2R_PGC_ − log2R_ESC_|, and Δ_soma_=|log2R_soma_ − log2R_ESC_| for each gene. Box-plots represent the distribution of the differences. Statistical significance was assessed using the Wilcoxon matched-pairs signed rank test (1-sided), **p=0.001. ND= not determined.
Figure 3. Developmental regulators remain bivalent and transcriptionally repressed during sexual differentiation in the germline
Developmental genes remain bivalent and transcriptionally silent from E11.5 to E13.5 in both the male and female germline. ChIP enrichment for H3K4me3 and H3K27me3 in E11.5-13.5 PGCs at the indicated genes is represented as the mean percent of input ± standard deviation for at least 2 biological replicates. Transcription was measured with qRT-PCR for the indicated genes and represented as a percent of the housekeeping gene L7 ± standard deviation. At all stages of PGC development analyzed, somatic developmental genes have a similar level of enrichment for H3K4me3 and H3K27me3 and very low expression. See also Figure S3.
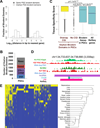
Figure 4. Orphan bivalent domains overlap CpG Islands and show tissue specific expression
(A) Distances of genic (assigned to gene, dark grey bars) and orphan PGC bivalent domains (white bars) to nearest gene, with transparent overlay. Distances are presented as the log base 10 of the genomic length in base pairs from bivalent domains to either their nearest gene, with bivalent domains upstream of their nearest gene assigned negative distances after logarithm. Bivalent domains occurring within a gene were assigned a genomic length of 1. TSSs were defined as the starting positions of RefSeq genes (B) Number of orphan bivalent domains in E11.5 PGCs with characteristics of transcription start site activity: occurring in unmethylated CpG islands (CGI) identified using CAP-Seq (Illingworth et al., 2010), with a CAGE expression tag in 1 or more of 22 tissue types (Kawaji et al., 2009), or both. (C) Distributions of the tissue-specificity scores of CAGE tag cluster expression in orphan bivalent domains with CGI in PGC, orphan bivalent domains without CGI in PGC, bivalent RefSeq genes, and all RefSeq genes. The p-values are from the Wilcoxon rank sum test. (D) UCSC Genome Browser view of an orphan bivalent domain in PGCs and ESCs (Mikkelsen et al., 2007) that overlaps a CGI (Illingworth et al., 2010) and a putative non-coding RNA (Guttman et al., 2009). RNA-Seq data indicates this region is transcriptionally silent in PGCs (Seisenberger et al., 2012) and ESCs (Marks et al., 2012), while CAGE tag data indicates expression in the hippocampus. (E) Hierarchical clustering of tissues based on the binary (on or off) expression status of CAGE tag clusters in regions marked as orphan bivalent domains in PGC. Yellow means expression and blue mean no expression. See also Table S2, S3.
Similar articles
- Chromatin remodeling and bivalent histone modifications in embryonic stem cells.
Harikumar A, Meshorer E. Harikumar A, et al. EMBO Rep. 2015 Dec;16(12):1609-19. doi: 10.15252/embr.201541011. Epub 2015 Nov 9. EMBO Rep. 2015. PMID: 26553936 Free PMC article. Review. - Bivalent Histone Modifications and Development.
Li F, Wan M, Zhang B, Peng Y, Zhou Y, Pi C, Xu X, Ye L, Zhou X, Zheng L. Li F, et al. Curr Stem Cell Res Ther. 2018;13(2):83-90. doi: 10.2174/1574888X12666170123144743. Curr Stem Cell Res Ther. 2018. PMID: 28117006 Review. - H2A.Z acidic patch couples chromatin dynamics to regulation of gene expression programs during ESC differentiation.
Subramanian V, Mazumder A, Surface LE, Butty VL, Fields PA, Alwan A, Torrey L, Thai KK, Levine SS, Bathe M, Boyer LA. Subramanian V, et al. PLoS Genet. 2013;9(8):e1003725. doi: 10.1371/journal.pgen.1003725. Epub 2013 Aug 22. PLoS Genet. 2013. PMID: 23990805 Free PMC article. - Bivalent histone modifications in early embryogenesis.
Vastenhouw NL, Schier AF. Vastenhouw NL, et al. Curr Opin Cell Biol. 2012 Jun;24(3):374-86. doi: 10.1016/j.ceb.2012.03.009. Epub 2012 Apr 17. Curr Opin Cell Biol. 2012. PMID: 22513113 Free PMC article. Review. - A low-input high resolution sequential chromatin immunoprecipitation method captures genome-wide dynamics of bivalent chromatin.
Seneviratne JA, Ho WWH, Glancy E, Eckersley-Maslin MA. Seneviratne JA, et al. Epigenetics Chromatin. 2024 Feb 10;17(1):3. doi: 10.1186/s13072-024-00527-9. Epigenetics Chromatin. 2024. PMID: 38336688 Free PMC article.
Cited by
- Resetting histone modifications during human prenatal germline development.
Gao R, Zeng S, Yang D, Li X, Liu W, Gao Y, Bai D, Zhang L, Chen C, Kang Y, Wang B, Hong W, Wang M, Yin J, Wang H, Deng Q, Gao S, Zhang Y, Chen J. Gao R, et al. Cell Discov. 2023 Feb 3;9(1):14. doi: 10.1038/s41421-023-00519-1. Cell Discov. 2023. PMID: 36737434 Free PMC article. - DNMTs and SETDB1 function as co-repressors in MAX-mediated repression of germ cell-related genes in mouse embryonic stem cells.
Tatsumi D, Hayashi Y, Endo M, Kobayashi H, Yoshioka T, Kiso K, Kanno S, Nakai Y, Maeda I, Mochizuki K, Tachibana M, Koseki H, Okuda A, Yasui A, Kono T, Matsui Y. Tatsumi D, et al. PLoS One. 2018 Nov 7;13(11):e0205969. doi: 10.1371/journal.pone.0205969. eCollection 2018. PLoS One. 2018. PMID: 30403691 Free PMC article. - A novel member of Prame family, Gm12794c, counteracts retinoic acid differentiation through the methyltransferase activity of PRC2.
Napolitano G, Tagliaferri D, Fusco S, Cirillo C, De Martino I, Addeo M, Mazzone P, Russo NA, Natale F, Cardoso MC, De Luca L, Lamorte D, La Rocca F, De Felice M, Falco G. Napolitano G, et al. Cell Death Differ. 2020 Jan;27(1):345-362. doi: 10.1038/s41418-019-0359-9. Epub 2019 Jun 11. Cell Death Differ. 2020. PMID: 31186534 Free PMC article. - KDM6A/UTX promotes spermatogenic gene expression across generations and is not required for male fertility†.
Walters BW, Rainsford SR, Heuer RA, Dias N, Huang X, de Rooij D, Lesch BJ. Walters BW, et al. Biol Reprod. 2024 Feb 10;110(2):391-407. doi: 10.1093/biolre/ioad141. Biol Reprod. 2024. PMID: 37861693 Free PMC article. - A novel bivalent chromatin associates with rapid induction of camalexin biosynthesis genes in response to a pathogen signal in Arabidopsis.
Zhao K, Kong D, Jin B, Smolke CD, Rhee SY. Zhao K, et al. Elife. 2021 Sep 15;10:e69508. doi: 10.7554/eLife.69508. Elife. 2021. PMID: 34523419 Free PMC article.
References
- Azuara V, Perry P, Sauer S, Spivakov M, Jørgensen HF, John RM, Gouti M, Casanova M, Warnes G, Merkenschlager M, et al. Chromatin signatures of pluripotent cell lines. Nature Cell Biology. 2006;8:532–538. - PubMed
Publication types
MeSH terms
Substances
Grants and funding
- P30 DK063720/DK/NIDDK NIH HHS/United States
- U54HD055764/HD/NICHD NIH HHS/United States
- U54 HD055764/HD/NICHD NIH HHS/United States
- DP2 OD004698/OD/NIH HHS/United States
- DP2OD004698/OD/NIH HHS/United States
- P50 HD055764/HD/NICHD NIH HHS/United States
LinkOut - more resources
Full Text Sources
Other Literature Sources
Molecular Biology Databases


