Eccentric contractions increase the phosphorylation of tuberous sclerosis complex-2 (TSC2) and alter the targeting of TSC2 and the mechanistic target of rapamycin to the lysosome - PubMed (original) (raw)
Eccentric contractions increase the phosphorylation of tuberous sclerosis complex-2 (TSC2) and alter the targeting of TSC2 and the mechanistic target of rapamycin to the lysosome
Brittany L Jacobs et al. J Physiol. 2013.
Abstract
The goal of this study was to determine whether the mechanical activation of mechanistic target of rapamycin (mTOR) signalling is associated with changes in phosphorylation of tuberous sclerosis complex-2 (TSC2) and targeting of mTOR and TSC2 to the lysosome. As a source of mechanical stimulation, mouse skeletal muscles were subjected to eccentric contractions (ECs). The results demonstrated that ECs induced hyper-phosphorylation of TSC2 and at least part of this increase occurred on residue(s) that fall within RxRxxS/T consensus motif(s). Furthermore, in control muscles, we found that both mTOR and TSC2 are highly enriched at the lysosome. Intriguingly, ECs enhanced the lysosomal association of mTOR and almost completely abolished the lysosomal association of TSC2. Based on these results, we developed a new model that could potentially explain how mechanical stimuli activate mTOR signalling. Furthermore, this is the first study to reveal that the activation of mTOR is associated with the translocation of TSC2 away from the lysosome. Since a large number of signalling pathways rely on TSC2 to control mTOR signalling, our results have potentially revealed a fundamental mechanism via which not only mechanical, but also various other types of stimuli, control mTOR signalling.
Figures
Figure 1. Eccentric contractions induce an increase in TSC2 phosphorylation
Mouse TA muscles were collected 1 h after a bout of eccentric contractions (EC) or the control condition. A, samples were subjected to Western blot (WB) analysis with the indicated antibodies. B, samples were immunoprecipitated with a TSC2 antibody and then treated with, or without, λ phosphatase (λPPase) and subjected to WB analysis for total TSC2. C, samples were immunoprecipitated with a TSC2 antibody, or a non-immune (IgG) antibody as a negative control, and then subjected to WB analysis for RxRxxS*/T* consensus motif phosphorylation. All images are representative of the average results obtained from _n_= 3–5 per group. _n_= number of samples.
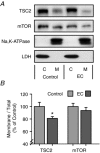
Figure 2. Eccentric contractions induce translocation of TSC2
Mouse TA muscles were collected 1 h after a bout of eccentric contractions (EC) or the control condition. A, samples were separated into cytosolic (C) and crude membrane (M) fractions, and then subjected to Western blot analysis for TSC2, mTOR and markers of cytosolic (LDH) and membrane (Na+,K+-ATPase)- associated proteins. B, the amount of TSC2 and mTOR in the membrane fraction was divided by the total amount found in both fractions, and then this value was expressed as a percentage of the mean value obtained in the control samples. Values in the graph represent the mean + SEM, _n_= 8 per group. *Significantly different from control, _P_≤ 0.05.
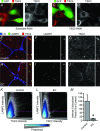
Figure 3. Eccentric contractions induce dissociation of TSC2 from the lysosome
C2C12 myoblasts were transfected with RNAi constructs that express GFP and a scrambled (control) RNAi (A and B), or GFP and an RNAi targeting TSC2 (C and D). At 72 h post transfection, the myoblasts were subjected to IHC for GFP and TSC2. A and C, merge of the signals obtained for GFP and TSC2; B and D, greyscale images of the signal obtained for TSC2 in A and C, respectively. E–J, semi-ultrathin sections from control (E–G) or eccentrically contracted (EC; H–J) TA muscles were subjected to IHC for laminin (LN), LAMP2 and TSC2. E and H, merge of the signals obtained for LN, LAMP2 and TSC2. F and I, greyscale image of the signal obtained for LAMP2 in E and H, respectively. G and J, greyscale image of the signal obtained for TSC2 in E and H, respectively. Pullouts to the right of each image represent a more highly magnified region. Scale bars represent 10 μm in the full size images and 2 μm in the pullouts. K and L, frequency scatterplots were generated by comparing the intensity of the signal for LAMP2 versus the intensity of the signal for TSC2 within every pixel of the images from control (K) or EC (L) muscles. The pink dashed lines represent the position of the threshold values that were used to characterize pixels as intensely positive for LAMP2 or TSC2. M, the number of pixels in each image that were intensely positive for both LAMP2 and TSC2 (i.e. colocalized) were quantified and then expressed as a percentage of the mean value obtained in the control samples. K–M, the data in each group were acquired from 23 randomly selected images (>3 × 107 pixels) that were obtained from 4 independent muscles. Values in the graph represent the mean + SEM. *Significantly different from control, _P_≤ 0.05.
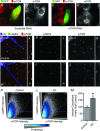
Figure 4. Eccentric contractions enhance the association of mTOR with the lysosome
C2C12 myoblasts were transfected with RNAi constructs that express GFP and a scrambled (control) RNAi (A and B), or GFP and an RNAi targeting mTOR (C and D). At 72 h post transfection, the myoblasts were subjected to IHC for GFP and mTOR. A and C, merge of the signals obtained for GFP and mTOR; B and D, greyscale images of the signal obtained for mTOR in A and C, respectively. E–J, semi-ultrathin sections from control (E–G) or eccentrically contracted (EC; H–J) TA muscles were subjected to IHC for laminin (LN), LAMP2 and mTOR. E and H, merge of the signals obtained for LN, LAMP2 and mTOR. F and I, greyscale image of the signal obtained for LAMP2 in E and H, respectively. G and J, greyscale image of the signal obtained for mTOR in E and H, respectively. Pullouts to the right of each image represent a more highly magnified region. Scale bars represent 10 μm in the full size images and 2 μm in the pullouts. K–L, frequency scatterplots were generated by comparing the intensity of the signal for LAMP2 versus the intensity of the signal for mTOR within every pixel of the images from control (K) or EC (L) muscles. The pink dashed lines represent the position of the threshold values that were used to characterize pixels as intensely positive for LAMP2 or mTOR. M, the number of pixels in each image that were intensely positive for both LAMP2 and mTOR (i.e. colocalized) were quantified and then expressed as a percentage of the mean value obtained in the control samples. K–M, the data in each group were acquired from 34 randomly selected images (>4 × 107 pixels) that were obtained from 4 independent muscles. Values in the graph represent the mean + SEM. *Significantly different from control, _P_≤ 0.05.
Figure 5. Conceptual model of how mechanical stimuli activate mTOR signalling
In this model, the skeletal muscle lysosomes serve as a major regulatory centre for controlling mTOR signalling. In response to the mechanically induced signalling events (shown with arrows), mTOR signalling transitions to its active state. See Discussion for details.
Comment in
- May the Force move you: TSC-ing the mechanical activation of mTOR.
West DW, Baar K. West DW, et al. J Physiol. 2013 Sep 15;591(18):4369-70. doi: 10.1113/jphysiol.2013.260216. J Physiol. 2013. PMID: 24037132 Free PMC article. No abstract available.
Similar articles
- Identification of mechanically regulated phosphorylation sites on tuberin (TSC2) that control mechanistic target of rapamycin (mTOR) signaling.
Jacobs BL, McNally RM, Kim KJ, Blanco R, Privett RE, You JS, Hornberger TA. Jacobs BL, et al. J Biol Chem. 2017 Apr 28;292(17):6987-6997. doi: 10.1074/jbc.M117.777805. Epub 2017 Mar 13. J Biol Chem. 2017. PMID: 28289099 Free PMC article. - Tuberous sclerosis-2 (TSC2) regulates the stability of death-associated protein kinase-1 (DAPK) through a lysosome-dependent degradation pathway.
Lin Y, Henderson P, Pettersson S, Satsangi J, Hupp T, Stevens C. Lin Y, et al. FEBS J. 2011 Jan;278(2):354-70. doi: 10.1111/j.1742-4658.2010.07959.x. Epub 2010 Dec 6. FEBS J. 2011. PMID: 21134130 - Insulin like growth factor-1-induced phosphorylation and altered distribution of tuberous sclerosis complex (TSC)1/TSC2 in C2C12 myotubes.
Miyazaki M, McCarthy JJ, Esser KA. Miyazaki M, et al. FEBS J. 2010 May;277(9):2180-91. doi: 10.1111/j.1742-4658.2010.07635.x. FEBS J. 2010. PMID: 20412061 Free PMC article. - A complex interplay between Akt, TSC2 and the two mTOR complexes.
Huang J, Manning BD. Huang J, et al. Biochem Soc Trans. 2009 Feb;37(Pt 1):217-22. doi: 10.1042/BST0370217. Biochem Soc Trans. 2009. PMID: 19143635 Free PMC article. Review. - Non-canonical functions of the tuberous sclerosis complex-Rheb signalling axis.
Neuman NA, Henske EP. Neuman NA, et al. EMBO Mol Med. 2011 Apr;3(4):189-200. doi: 10.1002/emmm.201100131. Epub 2011 Mar 16. EMBO Mol Med. 2011. PMID: 21412983 Free PMC article. Review.
Cited by
- Recent Data on Cellular Component Turnover: Focus on Adaptations to Physical Exercise.
Sanchez AM, Candau R, Bernardi H. Sanchez AM, et al. Cells. 2019 Jun 5;8(6):542. doi: 10.3390/cells8060542. Cells. 2019. PMID: 31195688 Free PMC article. Review. - The duration of glucocorticoid treatment alters the anabolic response to high-force muscle contractions.
Dunlap KR, Steiner JL, Hickner RC, Chase PB, Gordon BS. Dunlap KR, et al. J Appl Physiol (1985). 2023 Jul 1;135(1):183-195. doi: 10.1152/japplphysiol.00113.2023. Epub 2023 Jun 8. J Appl Physiol (1985). 2023. PMID: 37289956 Free PMC article. - Mechanosensitive Molecular Networks Involved in Transducing Resistance Exercise-Signals into Muscle Protein Accretion.
Rindom E, Vissing K. Rindom E, et al. Front Physiol. 2016 Nov 17;7:547. doi: 10.3389/fphys.2016.00547. eCollection 2016. Front Physiol. 2016. PMID: 27909410 Free PMC article. Review. - Advances in the Role of Leucine-Sensing in the Regulation of Protein Synthesis in Aging Skeletal Muscle.
Zhao Y, Cholewa J, Shang H, Yang Y, Ding X, Wang Q, Su Q, Zanchi NE, Xia Z. Zhao Y, et al. Front Cell Dev Biol. 2021 Apr 1;9:646482. doi: 10.3389/fcell.2021.646482. eCollection 2021. Front Cell Dev Biol. 2021. PMID: 33869199 Free PMC article. Review. - Leucine ingestion promotes mTOR translocation to the periphery and enhances total and peripheral RPS6 phosphorylation in human skeletal muscle.
Holowaty MNH, Lees MJ, Abou Sawan S, Paulussen KJM, Jäger R, Purpura M, Paluska SA, Burd NA, Hodson N, Moore DR. Holowaty MNH, et al. Amino Acids. 2023 Feb;55(2):253-261. doi: 10.1007/s00726-022-03221-w. Epub 2022 Dec 6. Amino Acids. 2023. PMID: 36474017
References
- Bodine SC, Stitt TN, Gonzalez M, Kline WO, Stover GL, Bauerlein R, Zlotchenko E, Scrimgeour A, Lawrence JC, Glass DJ, Yancopoulos GD. Akt/mTOR pathway is a crucial regulator of skeletal muscle hypertrophy and can prevent muscle atrophy in vivo. Nat Cell Biol. 2001;3:1014–1019. - PubMed
- Dan HC, Sun M, Yang L, Feldman RI, Sui XM, Ou CC, Nellist M, Yeung RS, Halley DJ, Nicosia SV, Pledger WJ, Cheng JQ. Phosphatidylinositol 3-kinase/Akt pathway regulates tuberous sclerosis tumor suppressor complex by phosphorylation of tuberin. J Biol Chem. 2002;277:35364–35370. - PubMed
Publication types
MeSH terms
Substances
LinkOut - more resources
Full Text Sources
Other Literature Sources
Molecular Biology Databases
Research Materials
Miscellaneous


