Ageing is associated with diminished muscle re-growth and myogenic precursor cell expansion early after immobility-induced atrophy in human skeletal muscle - PubMed (original) (raw)
Randomized Controlled Trial
. 2013 Aug 1;591(15):3789-804.
doi: 10.1113/jphysiol.2013.257121. Epub 2013 Jun 3.
U Frandsen, A L Mackey, L Jensen, L G Hvid, M L Bayer, S J Petersson, H D Schrøder, J L Andersen, P Aagaard, P Schjerling, M Kjaer
Affiliations
- PMID: 23732643
- PMCID: PMC3752458
- DOI: 10.1113/jphysiol.2013.257121
Randomized Controlled Trial
Ageing is associated with diminished muscle re-growth and myogenic precursor cell expansion early after immobility-induced atrophy in human skeletal muscle
C Suetta et al. J Physiol. 2013.
Abstract
Recovery of skeletal muscle mass from immobilisation-induced atrophy is faster in young than older individuals, yet the cellular mechanisms remain unknown. We examined the cellular and molecular regulation of muscle recovery in young and older human subjects subsequent to 2 weeks of immobility-induced muscle atrophy. Retraining consisted of 4 weeks of supervised resistive exercise in 9 older (OM: mean age) 67.3, range 61-74 yrs) and 11 young (YM: mean age 24.4, range 21-30 yrs) males. Measures of myofibre area (MFA), Pax7-positive satellite cells (SCs) associated with type I and type II muscle fibres, as well as gene expression analysis of key growth and transcription factors associated with local skeletal muscle milieu, were performed after 2 weeks immobility (Imm) and following 3 days (+3d) and 4 weeks (+4wks) of retraining. OM demonstrated no detectable gains in MFA (vastus lateralis muscle) and no increases in number of Pax7-positive SCs following 4wks retraining, whereas YM increased their MFA (P < 0.05), number of Pax7-positive cells, and had more Pax7-positive cells per type II fibre than OM at +3d and +4wks (P < 0.05). No age-related differences were observed in mRNA expression of IGF-1Ea, MGF, MyoD1 and HGF with retraining, whereas myostatin expression levels were more down-regulated in YM compared to OM at +3d (P < 0.05). In conclusion, the diminished muscle re-growth after immobilisation in elderly humans was associated with a lesser response in satellite cell proliferation in combination with an age-specific regulation of myostatin. In contrast, expression of local growth factors did not seem to explain the age-related difference in muscle mass recovery.
Figures
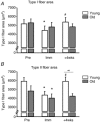
Figure 1. Changes in myofibre cross-sectional area following 2 weeks of immobilisation and 4 weeks of retraining in young and older human individuals
A, type I myofibre cross-sectional area. B, type II myofibre cross-sectional area. Open bars represent young (_n_= 9) and grey bars represent older individuals (_n_= 7). Pre, ∼1 week prior to the immobilisation; Imm, after 2 weeks of immobilisation; +4wks, after 28 days of retraining. *Time effect, P < 0.05, compared to Pre. #Time effect, P < 0.05 compared to Imm. ∞Age effect, P < 0.05 young compared to old within time point. Group mean data ± SEM.
Figure 2. Pax7-positive cells associated with type I and II myofibres
Immunohistochemically detected Pax7+ cells, type I myosin and laminin on a muscle biopsy cross-section. Pax7+ cells (black arrows) are visualised by light microscopy (brown; upper left, ‘Pax7’), and type I myosin staining (red) used to indicate Pax7+ cells associated with type I fibres (A4.951+; red) or type II fibres (unstained; upper right, ‘A4.951’). Laminin staining (green) was used to mark the myofibre basal membrane (lower left, ‘Laminin’). In the merged image of the three stainings for Pax7, type I myosin (A4.951) and laminin, a Pax7+ cell was located within a type I fibre while two Pax7+ cells were identified in type II fibres (lower right, ‘Merged’). Scale bar, 100 μm.
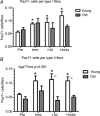
Figure 3. Pax7-positive cells pre- and post immobilisation and following 4 weeks of retraining: association with fibre type
A, number of Pax7+ cells associated with fibre type I. B, number of Pax7-positive satellite cells associated with fibre type II. +3d, after 3 days of retraining. *Time effect, P < 0.05 compared to Pre. ∞Age effect, P < 0.05 difference between young and old within time point. Data are means ± SEM.
Figure 4. mRNA values relative to the young group at baseline (Pre)
*Age effect, P < 0.05 young compared to old. Data are geometric means ± back-transformed SEM.
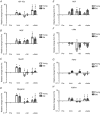
Figure 5. mRNA expression levels relative to baseline following 2 weeks of immobilisation and 4 weeks of retraining
A, IGF-1Ea; B, MGF; C, MyoD1; D, myogenin; E, HGF; F, c-Met; G, FGF2; H, FGFR1; I, Pax7; J, myostatin; K, CDKN1A (p21); L, CDKN1B (p27). *Time effect, P < 0.05 compared to Pre. #Time effect, P < 0.05 compared to Imm. §Time effect, P < 0.05 compared to +3d. ∞Age effect, P < 0.05 young compared to old. Data are geometric means ± back-transformed SEM.
Figure 6. Association between changes in myofibre area and number of Pax7+ cells
A, number of Pax7+ cells versus fibre area for all fibres collapsed or separated into type I or II fibres post immobilisation (Imm). B, relative changes in myofibre area (MFA, type I or type II) following 4 weeks of retraining (relative to post immobilisation) versus the change in number of Pax7+ cells (total, type I associated and type II associated). Open triangles, young individuals; filled triangles, older individuals.
Comment in
- Immobility and diminished skeletal muscle recovery with age: the sedentary myoblast.
Stewart CE. Stewart CE. J Physiol. 2013 Aug 1;591(15):3671-2. doi: 10.1113/jphysiol.2013.260141. J Physiol. 2013. PMID: 23908407 Free PMC article. No abstract available.
Similar articles
- Impact of resistance loading on myostatin expression and cell cycle regulation in young and older men and women.
Kim JS, Cross JM, Bamman MM. Kim JS, et al. Am J Physiol Endocrinol Metab. 2005 Jun;288(6):E1110-9. doi: 10.1152/ajpendo.00464.2004. Epub 2005 Jan 11. Am J Physiol Endocrinol Metab. 2005. PMID: 15644458 - Effects of resistance training on expression of IGF-I splice variants in younger and older men.
Ahtiainen JP, Hulmi JJ, Lehti M, Kraemer WJ, Nyman K, Selänne H, Alen M, Komulainen J, Kovanen V, Mero AA, Philippou A, Laakkonen EK, Häkkinen K. Ahtiainen JP, et al. Eur J Sport Sci. 2016 Nov;16(8):1055-63. doi: 10.1080/17461391.2016.1185164. Epub 2016 May 27. Eur J Sport Sci. 2016. PMID: 27231807 - The molecular regulation of muscle stem cell function.
Rudnicki MA, Le Grand F, McKinnell I, Kuang S. Rudnicki MA, et al. Cold Spring Harb Symp Quant Biol. 2008;73:323-31. doi: 10.1101/sqb.2008.73.064. Epub 2009 Mar 27. Cold Spring Harb Symp Quant Biol. 2008. PMID: 19329572 Review. - Muscle atrophy in immobilization and senescence in humans.
Murton AJ, Greenhaff PL. Murton AJ, et al. Curr Opin Neurol. 2009 Oct;22(5):500-5. doi: 10.1097/WCO.0b013e32832f15e1. Curr Opin Neurol. 2009. PMID: 19553812 Review.
Cited by
- Filbertone Reduces Senescence in C2C12 Myotubes Treated with Doxorubicin or H2O2 through MuRF1 and Myogenin.
Jung S, Ahn B. Jung S, et al. Nutrients. 2024 Sep 19;16(18):3177. doi: 10.3390/nu16183177. Nutrients. 2024. PMID: 39339777 Free PMC article. - Hotspots and trends in satellite cell research in muscle regeneration: A bibliometric visualization and analysis from 2010 to 2023.
Huang N, Zou K, Zhong Y, Luo Y, Wang M, Xiao L. Huang N, et al. Heliyon. 2024 Sep 5;10(18):e37529. doi: 10.1016/j.heliyon.2024.e37529. eCollection 2024 Sep 30. Heliyon. 2024. PMID: 39309858 Free PMC article. - Five days of bed rest in young and old adults: Retainment of skeletal muscle mass with neuromuscular electrical stimulation.
Hansen SK, Hansen P, Nygaard H, Grønbæk HD, Berry TW, Olsen CM, Aagaard P, Hvid LG, Agergaard J, Dela F, Suetta C. Hansen SK, et al. Physiol Rep. 2024 Aug;12(16):e16166. doi: 10.14814/phy2.16166. Physiol Rep. 2024. PMID: 39155274 Free PMC article. - Age-related differences in the loss and recovery of serial sarcomere number following disuse atrophy in rats.
Hinks A, Power GA. Hinks A, et al. Skelet Muscle. 2024 Aug 2;14(1):18. doi: 10.1186/s13395-024-00351-5. Skelet Muscle. 2024. PMID: 39095894 Free PMC article. - Skeletal muscle dysfunction with advancing age.
Pabla P, Jones EJ, Piasecki M, Phillips BE. Pabla P, et al. Clin Sci (Lond). 2024 Jul 17;138(14):863-882. doi: 10.1042/CS20231197. Clin Sci (Lond). 2024. PMID: 38994723 Free PMC article. Review.
References
- Aagaard P, Suetta C, Caserotti P, Magnusson SP, Kjaer M. Role of the nervous system in sarcopenia and muscle atrophy with aging: strength training as a countermeasure. Scand J Med Sci Sports. 2010;20:49–64. - PubMed
- Adams GR, Haddad F. The relationships among IGF–1, DNA content, and protein accumulation during skeletal muscle hypertrophy. J Appl Physiol. 1996;81:2509–2516. - PubMed
- Allen RE, Boxhorn LK. Regulation of skeletal muscle satellite cell proliferation and differentiation by transforming growth factor-beta, insulin-like growth factor I, and fibroblast growth factor. J Cell Physiol. 1989;138:311–315. - PubMed
- Allen RE, Sheehan SM, Taylor RG, Kendall TL, Rice GM. Hepatocyte growth factor activates quiescent skeletal muscle satellite cells in vitro. J Cell Physiol. 1995;165:307–312. - PubMed
- Alway SE, Dawn AL, Kuangjen DC. The effects of age and hindlimb supension on the levels of expression of the myogenic regulatory factors MyoD and myogenin in rat fast and slow skeletal muscles. Exp Physiol. 2001;86:509–517. - PubMed
Publication types
MeSH terms
Substances
LinkOut - more resources
Full Text Sources
Other Literature Sources
Medical
Miscellaneous


