Tyrosine kinase inhibition increases functional parkin-Beclin-1 interaction and enhances amyloid clearance and cognitive performance - PubMed (original) (raw)
Tyrosine kinase inhibition increases functional parkin-Beclin-1 interaction and enhances amyloid clearance and cognitive performance
Irina Lonskaya et al. EMBO Mol Med. 2013 Aug.
Abstract
Tyrosine kinase inhibitors (TKIs) are effective therapies for leukaemia. Alzheimer is a neurodegenerative disease characterized by accumulation of β-amyloid (plaques) and hyper-phosphorylated Tau (tangles). Here we show that AD animals have high levels of insoluble parkin and decreased parkin-Beclin-1 interaction, while peripheral administration of TKIs, including Nilotinib and Bosutinib, increases soluble parkin leading to amyloid clearance and cognitive improvement. Blocking Beclin-1 expression with shRNA or parkin deletion prevents tyrosine kinase (TK) inhibition-induced amyloid clearance, suggesting that functional parkin-Beclin-1 interaction mediates amyloid degradation. Isolation of autophagic vacuoles (AVs) in AD mouse brain shows accumulation of parkin and amyloid, consistent with previous results in AD brains, while Bosutinib and Nilotinib increase parkin-Beclin-1 interaction and result in protein deposition in the lysosome. These data suggest that decreased parkin solubility impedes parkin-Beclin-1 interaction and amyloid clearance. We identified two FDA-approved anti-cancer drugs as potential treatment for AD.
Keywords: Tau phosphorylation; autophagy; parkin; tyrosine kinase; β-amyloid.
© 2013 The Authors. Published by John Wiley and Sons, Ltd on behalf of EMBO.
Figures
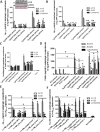
Figure 1
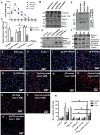
Tyrosine Kinase inhibition restores parkin-Beclin-1 interaction
- Graph represents brain levels of TKIs over a 24 hr period after IP injection with Imatinib, Nilotinib, Bosutinib and DMSO (N = 7). [Correction added after publication on 4 July 2013: The y axis of the graph shown in Fig. 1A has been corrected from “concentration (mM)” to “concentration (nM)”]
- WB in Tg-APP total brain lysates on 4–12% NuPAGE SDS gel (Invitrogen) show total Abl (top blot) T412 Abl (2nd blot), soluble parkin level (3rd blot), and LC3 (4th blot) relative to MAP-2 (N = 9).
- Quantitative ELISA showing soluble (STEN extract) and insoluble (4 M urea extract) mouse parkin in Tg-APP (N = 9). Parkin−/− brains were used as a specificity control.
- (D) Blots represent immunoprecipitated Beclin-1 in mice probed with parkin antibody, and (E) control IgG in parallel with immunoprecipitates, (F) immunoprecipitated Beclin-1 probed with parkin and the reverse experiment in post-mortem human AD cortex analyzed on 4–12% SDS-NuPAGE gel.
- In situ proximity ligation assay (PLA) shows endogenous parkin-Beclin-1 complexes in (G) WT C57BL/6 mice (N = 5) and (H) parkin−/− as control.
- PLA in Tg-APP mice IP injected once daily for 3 weeks with (I) DMSO (J) 5 mg/kg Bosutinib and (K) 10 mg/kg Nilotinib (N = 5).
- PLA in human post-mortem brains in the (L) cortex of a normal subject and (M) cortex of an AD patient; the hippocampus of (N) a normal subject and (O) an AD patient; the caudate of (P) a normal subject and (Q) an AD patient.
- Graph represents human Aβ1–42 ELISA in rat B35 neuroblastoma cells transfected with human cDNA Aβ1–42 (or LacZ) or Beclin-1 shRNA for 24 hr, and then treated with 1 μM Bosutinib for an additional 24 hr (N = 12). *Significantly different to control or as indicated, Mean ± SEM, ANOVA with NeumannKeuls multiple comparison.
Figure 2
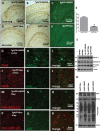
Bosutinib decreases Aβ levels and eliminates plaques in AD models
- Staining of 20 μm brain sections shows plaque formation with 6E10 antibody and DAB in the brain in different (A,B) Tg-APP + DMSO and (C) thioflavin-S staining in Tg-APP treated with DMSO (N = 7). (D,E) Tg-APP treated with 5 mg/kg Bosutinib for 3-weeks and (F) thioflavin-s staining.
- Staining of 20 μm thick brain sections shows (G) parkin, (H) Aβ1–42 and (I) merged figure in cortex of Tg-APP mice after 3 weeks of DMSO treatment, and (J) parkin, (K) Aβ1–42 and (L) merged figure in cortex of Tg-APP mice after 3 weeks of 5 mg/kg Bosutinib treatment. (M) Parkin, (N) Aβ1–42 and (O) merged figure in hippocampus of Tg-APP mice after 3 weeks of DMSO treatment, and (P) parkin, (Q) Aβ1–42 and (R) merged figure in cortex of Tg-APP mice after 3 weeks of Bosutinib treatment (N = 7).
- (S) Graphs represent quantification of amyloid plaques in Tg-APP with and without Bosutinib. WB in Tg-APP total brain lysates on 4–12% NuPAGE SDS gel (Invitrogen) showing (T) levels of BACE1 (1st blot), ADAM-10 (2nd blot) and presinilin-1 (3rd blot) relative to actin and (U) total APP (top blot), CTFs (2nd blot) and phospho-tyrosine (3rd blot) relative to actin (N = 9).
Figure 3
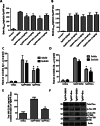
Chronic treatment with TKI alters brain amyloid level*Significantly different to control, Mean ± SEM, ANOVA with Neumann Keuls multiple comparison, p < 0.05.
- Graphs represent ELISA of human Aβ1–42 in (A) brain levels and (B) blood Aβ1–42 levels in 8-month old Tg-APP mice injected I.P. every other day for 6 weeks with Bosutinib or Nilotinib (N = 10).
- ELISA of human soluble and insoluble brain (C) Aβ1–42 and (D) Aβ1-40 levels as well as (E) mouse p-Tau levels in 8-month old Tg-APP mice injected IP daily for 3 weeks with 5 mg/kg Bosutinib (N = 9).
- WB in Tg-APP total brain lysates on 4–12% NuPAGE SDS gel (Invitrogen) show total Tau (1st blot), serine 396 p-Tau (2nd blot), threonine 231 (AT180, 3rd blot) and serine 199 p-Tau (AT8, 4th blot) relative to actin (N = 7).
Figure 4
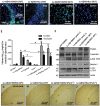
Bosutinib degrades lentiviral Aβ1–42 in a parkin-dependent manner
- Staining of 20μm brain sections shows intracellular Aβ1–42 within the (A) hippocampus of lentiviral Aβ1–42 injected WT mice, and (B) Bosutinib clearance of intracellular Aβ1–42. Staining of 20μm brain sections shows intracellular Aβ1–42 within the (C) cortex of WT mice with the lentiviral Aβ1–42, and (D) Bosutinib clearance of intracellular Aβ1–42 (N = 7).
- ELISA of human soluble and insoluble Aβ1–42 at 6 weeks post-injection of lentiviral Aβ1–42 and daily treatment with 5 mg/kg Bosutinib (N = 9) for 3 weeks. * Significantly different to control or as indicated, Mean ± SEM, ANOVA with Neumann Keuls multiple comparison.
- WB on 4–12% NuPAGE SDS gel of total brain lysates in 1 year old wild type and parkin−/− mice treated with 5 mg/kg Bosutinib for 3 weeks on 4–12% NuPAGE SDS gel (Invitrogen) showing parkin (1st blot)total Abl (2nd blot), T412 Abl (3rd blot), Beclin-1 (4th blot) and LC3 (5th blot) relative to actin (N = 7).
- Staining of 20μm brain sections shows plaque formation with 6E10 antibody and DAB 6 weeks post-injection with (G) lentiviral Aβ1–42 + 3 weeks DMSO treatment and (H) IP injection with 5 mg/kg Bosutinib 3 weeks post-lentiviral expression (3 weeks treatment) clears plaques in WT mice (N = 7).(I) Lentiviral Aβ1–42 + DMSO and (J) IP injection with 5 mg/kg Bosutinib 3 weeks post-lentiviral expression (3 weeks treatment) in parkin−/− mice (N = 7).
Figure 5
Subcellular fractionation suggests impaired autophagy in the absence of parkin*Significantly different to control or as indicated, Mean ± SEM, ANOVA with Neumann Keuls multiple comparison.
- Graphs represent ELISA (N = 5) inautophagic vacuoles (AVs) in the brain of 4 and 8 months old Tg-APP mice treated with 10 mg/kg Nilotinib or 5 mg/kg Bosutinib (N = 5) for 3 weeks showing (A)human Aβ1–42 (Insert is WB analysis of AVs showing LC3-B in AV10 and AV20 (1st blot) and LAMP2a in Lys (2nd blot) fraction) and (B)Aβ1-40,(C) p-Tau and (D) parkin.
- ELISA in autophagic vacuoles of 1 year old WT and parkin−/− mice (N = 5) injected with lentiviralAβ1–42 for 3 weeks and treated with 10 mg/kg Nilotinib and 5 mg/kg Bosutinib for 3 additional weeks showing (E) human Aβ1–42 and (F) p-Tau levels.
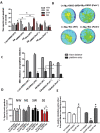
Figure 6
Bosutinib improves cognitive performance in a parkin-dependent manner*Significantly different to DMSO or as indicated, Mean ± SEM, ANOVA with Neumann Keuls multiple comparison.
- (A) Represents results of Morris water maze test in lentiviralAβ1–42-injected ± Bosutinib WT (N = 12) and parkin−/− (N = 10) mice, and (B) heat maps for each group.
- Graphs represent total number of entry into platform area and distance travelled.
- Represents results of Morris water maze test in Tg-APP ± Bosutinib (N = 12) mice.
- Graphs represent total number of entry into platform area and distance travelled.
Similar articles
- Nilotinib-induced autophagic changes increase endogenous parkin level and ubiquitination, leading to amyloid clearance.
Lonskaya I, Hebron ML, Desforges NM, Schachter JB, Moussa CE. Lonskaya I, et al. J Mol Med (Berl). 2014 Apr;92(4):373-86. doi: 10.1007/s00109-013-1112-3. Epub 2013 Dec 13. J Mol Med (Berl). 2014. PMID: 24337465 Free PMC article. - Diminished parkin solubility and co-localization with intraneuronal amyloid-β are associated with autophagic defects in Alzheimer's disease.
Lonskaya I, Shekoyan AR, Hebron ML, Desforges N, Algarzae NK, Moussa CE. Lonskaya I, et al. J Alzheimers Dis. 2013;33(1):231-47. doi: 10.3233/JAD-2012-121141. J Alzheimers Dis. 2013. PMID: 22954671 - Nilotinib and bosutinib modulate pre-plaque alterations of blood immune markers and neuro-inflammation in Alzheimer's disease models.
Lonskaya I, Hebron ML, Selby ST, Turner RS, Moussa CE. Lonskaya I, et al. Neuroscience. 2015 Sep 24;304:316-27. doi: 10.1016/j.neuroscience.2015.07.070. Epub 2015 Jul 30. Neuroscience. 2015. PMID: 26235435 - Impaired autophagy and APP processing in Alzheimer's disease: The potential role of Beclin 1 interactome.
Salminen A, Kaarniranta K, Kauppinen A, Ojala J, Haapasalo A, Soininen H, Hiltunen M. Salminen A, et al. Prog Neurobiol. 2013 Jul-Aug;106-107:33-54. doi: 10.1016/j.pneurobio.2013.06.002. Epub 2013 Jul 1. Prog Neurobiol. 2013. PMID: 23827971 Review. - Cross-functional E3 ligases Parkin and C-terminus Hsp70-interacting protein in neurodegenerative disorders.
Kumar P, Pradhan K, Karunya R, Ambasta RK, Querfurth HW. Kumar P, et al. J Neurochem. 2012 Feb;120(3):350-70. doi: 10.1111/j.1471-4159.2011.07588.x. Epub 2011 Dec 21. J Neurochem. 2012. PMID: 22098618 Review.
Cited by
- Cell Biology of Parkin: Clues to the Development of New Therapeutics for Parkinson's Disease.
Patel J, Panicker N, Dawson VL, Dawson TM. Patel J, et al. CNS Drugs. 2022 Dec;36(12):1249-1267. doi: 10.1007/s40263-022-00973-7. Epub 2022 Nov 15. CNS Drugs. 2022. PMID: 36378485 Review. - Repurposing Proteostasis-Modifying Drugs to Prevent or Treat Age-Related Dementia: A Systematic Review.
Heard DS, Tuttle CSL, Lautenschlager NT, Maier AB. Heard DS, et al. Front Physiol. 2018 Oct 30;9:1520. doi: 10.3389/fphys.2018.01520. eCollection 2018. Front Physiol. 2018. PMID: 30425653 Free PMC article. - Induced pluripotent stem cell-based Drug Repurposing for Amyotrophic lateral sclerosis Medicine (iDReAM) study: protocol for a phase I dose escalation study of bosutinib for amyotrophic lateral sclerosis patients.
Imamura K, Izumi Y, Banno H, Uozumi R, Morita S, Egawa N, Ayaki T, Nagai M, Nishiyama K, Watanabe Y, Hanajima R, Oki R, Fujita K, Takahashi N, Ikeda T, Shimizu A, Morinaga A, Hirohashi T, Fujii Y, Takahashi R, Inoue H. Imamura K, et al. BMJ Open. 2019 Dec 2;9(12):e033131. doi: 10.1136/bmjopen-2019-033131. BMJ Open. 2019. PMID: 31796494 Free PMC article. - Tau and neuroinflammation in Alzheimer's disease: interplay mechanisms and clinical translation.
Chen Y, Yu Y. Chen Y, et al. J Neuroinflammation. 2023 Jul 14;20(1):165. doi: 10.1186/s12974-023-02853-3. J Neuroinflammation. 2023. PMID: 37452321 Free PMC article. Review. - Association of p53 with Neurodegeneration in Parkinson's Disease.
Luo Q, Sun W, Wang YF, Li J, Li DW. Luo Q, et al. Parkinsons Dis. 2022 May 11;2022:6600944. doi: 10.1155/2022/6600944. eCollection 2022. Parkinsons Dis. 2022. PMID: 35601652 Free PMC article. Review.
References
- Alvarez AR, Sandoval PC, Leal NR, Castro PU, Kosik KS. Activation of the neuronal c-Abl tyrosine kinase by amyloid-beta-peptide and reactive oxygen species. Neurobiol Dis. 2004;17:326–336. - PubMed
- Cancino GI, Perez de Arce K, Castro PU, Toledo EM, von Bernhardi R, Alvarez AR. c-Abl tyrosine kinase modulates tau pathology and Cdk5 phosphorylation in AD transgenic mice. Neurobiol Aging. 2011;32:1249–1261. - PubMed
- Cancino GI, Toledo EM, Leal NR, Hernandez DE, Yevenes LF, Inestrosa NC, Alvarez AR. STI571 prevents apoptosis, tau phosphorylation and behavioural impairments induced by Alzheimer's beta-amyloid deposits. Brain. 2008;131:2425–2442. - PubMed
Publication types
MeSH terms
Substances
LinkOut - more resources
Full Text Sources
Other Literature Sources
